Fig. 9.
Download original image
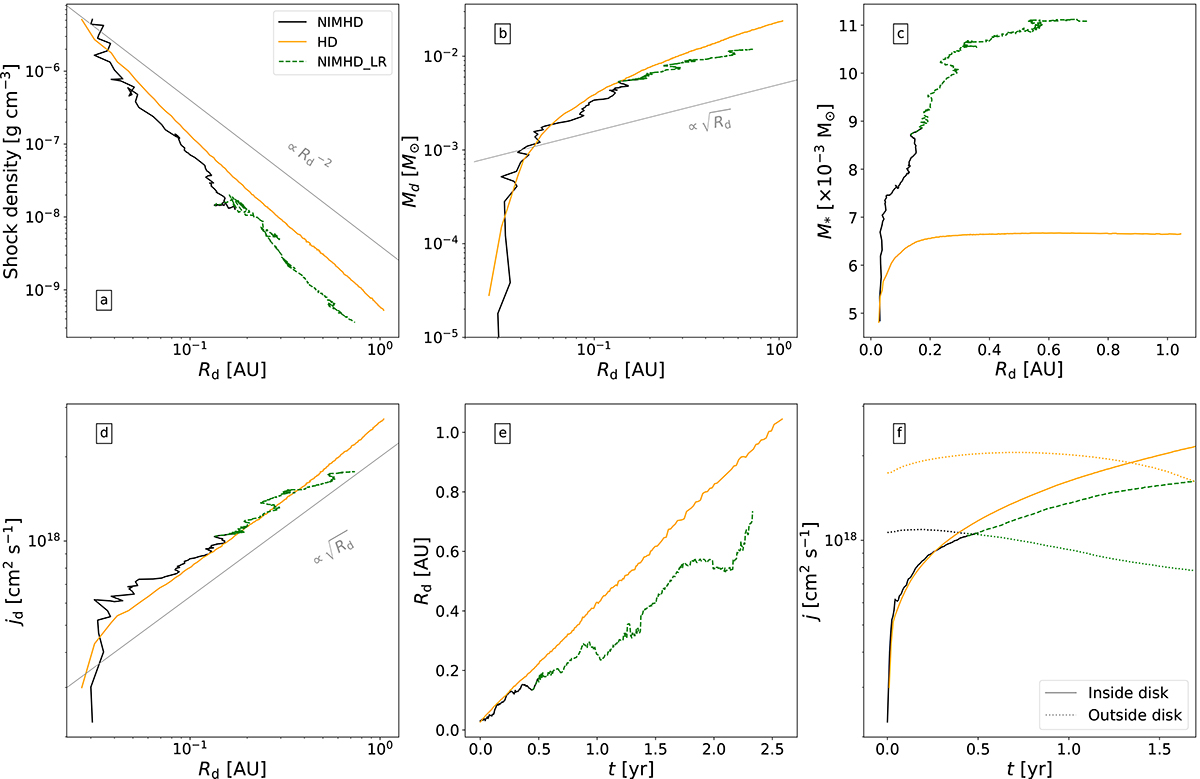
Temporal evolution of the circumstellar disk of run NIMHD (black curves), compared with its hydro counterpart (orange curves; from Ahmad et al. 2024). The green curves are a zoom-out, branched from run NIMHD and run at a lower resolution with ℓmax = 24 (see Sect. 2.2). Panels (a), (b), (c), and (d) respectively display as a function of the disk’s equatorial radius Rd the density measured at the disk’s equatorial shock front (obtained through ray-tracing), the mass of the disk, the mass of the protostar, and the disk’s specific angular momentum. Panel (e) displays Rd as a function of time, where t = 0 marks the moment of birth of the disk. Panel (f) displays the specific angular momentum of the gas within 1 AU found inside the disk (solid and dashed lines) and outside the disk (dotted lines) as a function of time since the birth of the disk.
Current usage metrics show cumulative count of Article Views (full-text article views including HTML views, PDF and ePub downloads, according to the available data) and Abstracts Views on Vision4Press platform.
Data correspond to usage on the plateform after 2015. The current usage metrics is available 48-96 hours after online publication and is updated daily on week days.
Initial download of the metrics may take a while.