Fig. 3.
Download original image
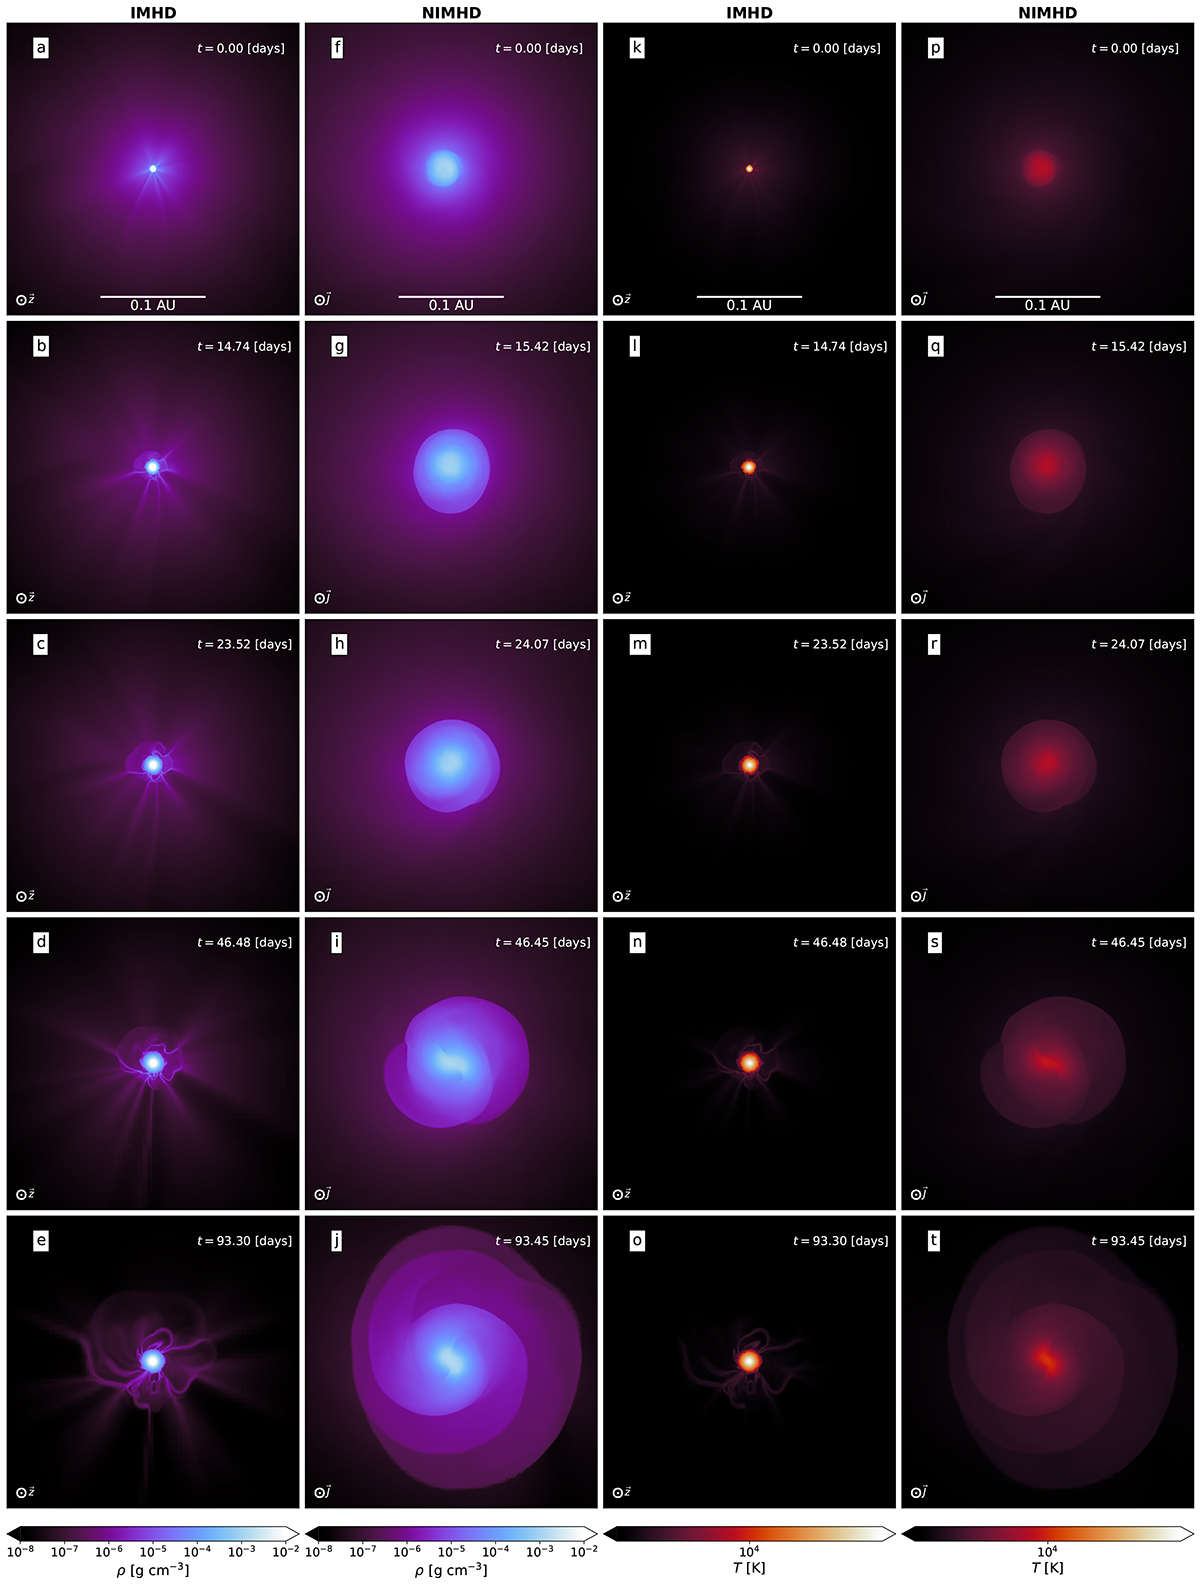
Set of slices showing the evolution of the density (first two columns) and temperature (last two columns) for run IMHD (first and third columns, panels a–e and k–o) and run NIMHD (second and fourth columns, panels f–j and p–t). Each row represents a different time, where t = 0 corresponds to the moment of protostellar birth. For comparative purposes, the slices are shown at similar times, and the timestamp is written in the top right corner of each panel. The slices are done in the z direction for run IMHD, and along the angular momentum vector for run NIMHD. The scale bars in the first row apply to all the other rows as well.
Current usage metrics show cumulative count of Article Views (full-text article views including HTML views, PDF and ePub downloads, according to the available data) and Abstracts Views on Vision4Press platform.
Data correspond to usage on the plateform after 2015. The current usage metrics is available 48-96 hours after online publication and is updated daily on week days.
Initial download of the metrics may take a while.