Fig. B1.
Download original image
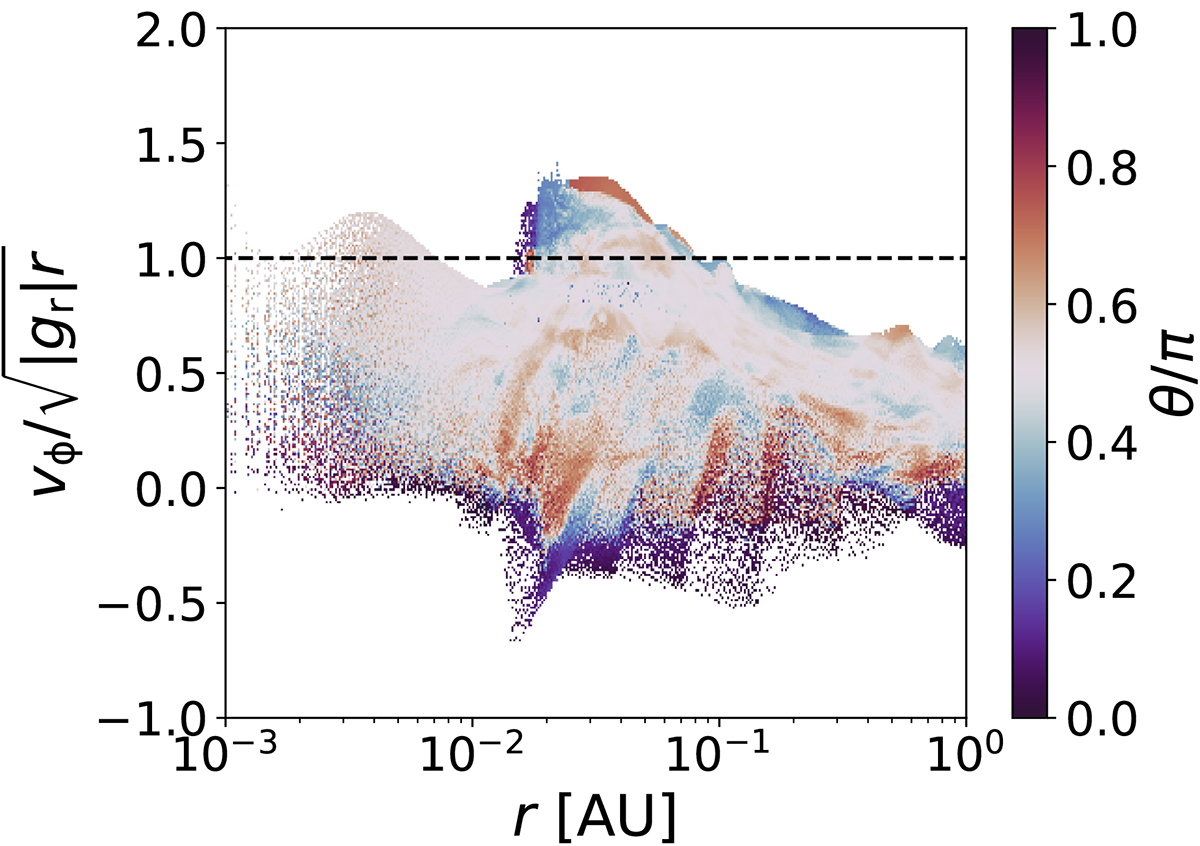
2D histogram binning all the cells in run NIMHD at t ≈ 0.3 yr (where t = 0 corresponds to the epoch of protostellar birth), which shows the distribution of azimuthal velocities divided by ![]() with respect to radius. The color-coding in the histograms represents the co-latitude θ divided by π, where θ/π = 0.5 corresponds to the equator and θ/π = 1 (respectively 0) corresponds to the south (respectively north) pole.
with respect to radius. The color-coding in the histograms represents the co-latitude θ divided by π, where θ/π = 0.5 corresponds to the equator and θ/π = 1 (respectively 0) corresponds to the south (respectively north) pole.
Current usage metrics show cumulative count of Article Views (full-text article views including HTML views, PDF and ePub downloads, according to the available data) and Abstracts Views on Vision4Press platform.
Data correspond to usage on the plateform after 2015. The current usage metrics is available 48-96 hours after online publication and is updated daily on week days.
Initial download of the metrics may take a while.