Fig. 6.
Download original image
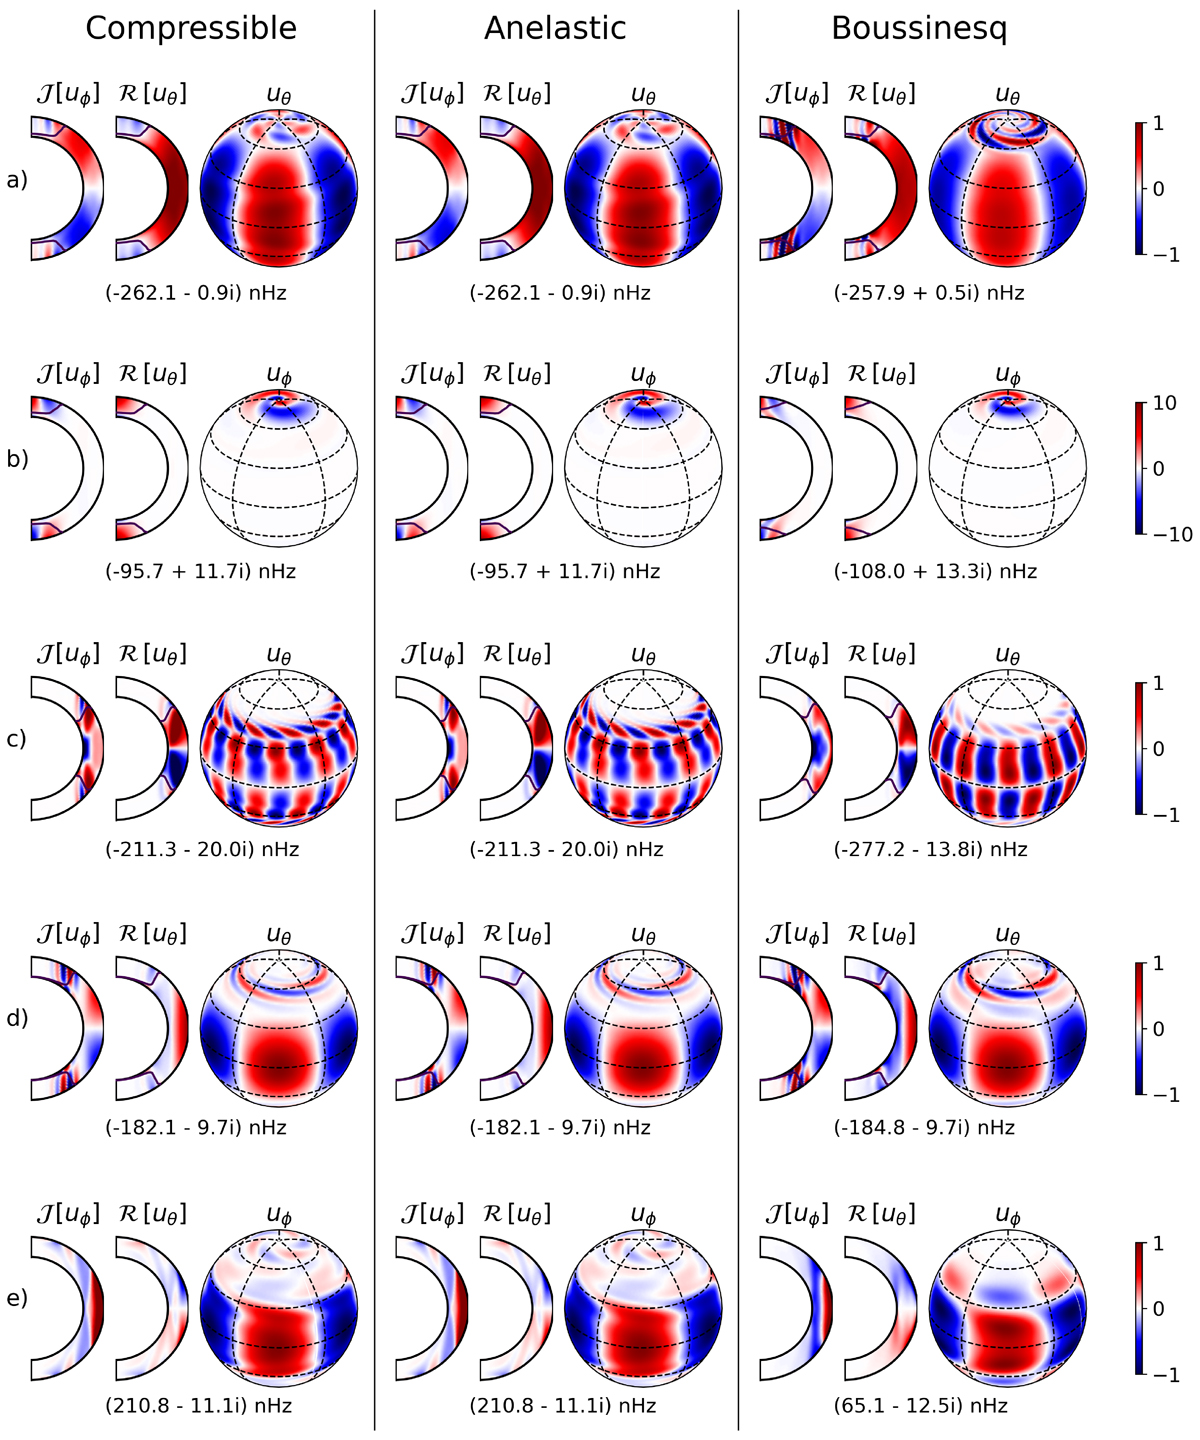
Comparison of the eigenmodes for different classes of inertial modes computed using compressible, anelastic, and Boussinesq models under solar differential rotation and the associated latitudinal entropy gradient. The different rows denote: a) n = 0 equatorial Rossby mode (m = 3), b) high-latitude mode with north-south symmetric radial vorticity (m = 1), c) HFR mode (m = 10), d) n = 1 equatorial Rossby mode (m = 3), e) prograde columnar mode (m = 3). Here, we plot the real part of uθ and the imaginary part of uϕ of the computed eigenmodes in the meridional plane. The corresponding longitudes are chosen in the same way as in Fig. 2. The black solid curves on the meridional cross-sections denote the critical latitudes where ℜ[ω]=m(Ω − Ω0). We also show the surface velocity: uϕ for the high-latitude mode and the prograde columnar mode, and uθ for the other modes. The corresponding frequencies in the Carrington frame are stated below each eigenmode. The imaginary parts of the frequencies are the growth rates of the modes. All eigenfunctions, except for the high-latitude mode, are normalized such that the maximum of uθ is 1 m/s at the surface. For the high-latitude mode, the maximum velocity at the surface is set to 10 m/s.
Current usage metrics show cumulative count of Article Views (full-text article views including HTML views, PDF and ePub downloads, according to the available data) and Abstracts Views on Vision4Press platform.
Data correspond to usage on the plateform after 2015. The current usage metrics is available 48-96 hours after online publication and is updated daily on week days.
Initial download of the metrics may take a while.