Fig. 1.
Download original image
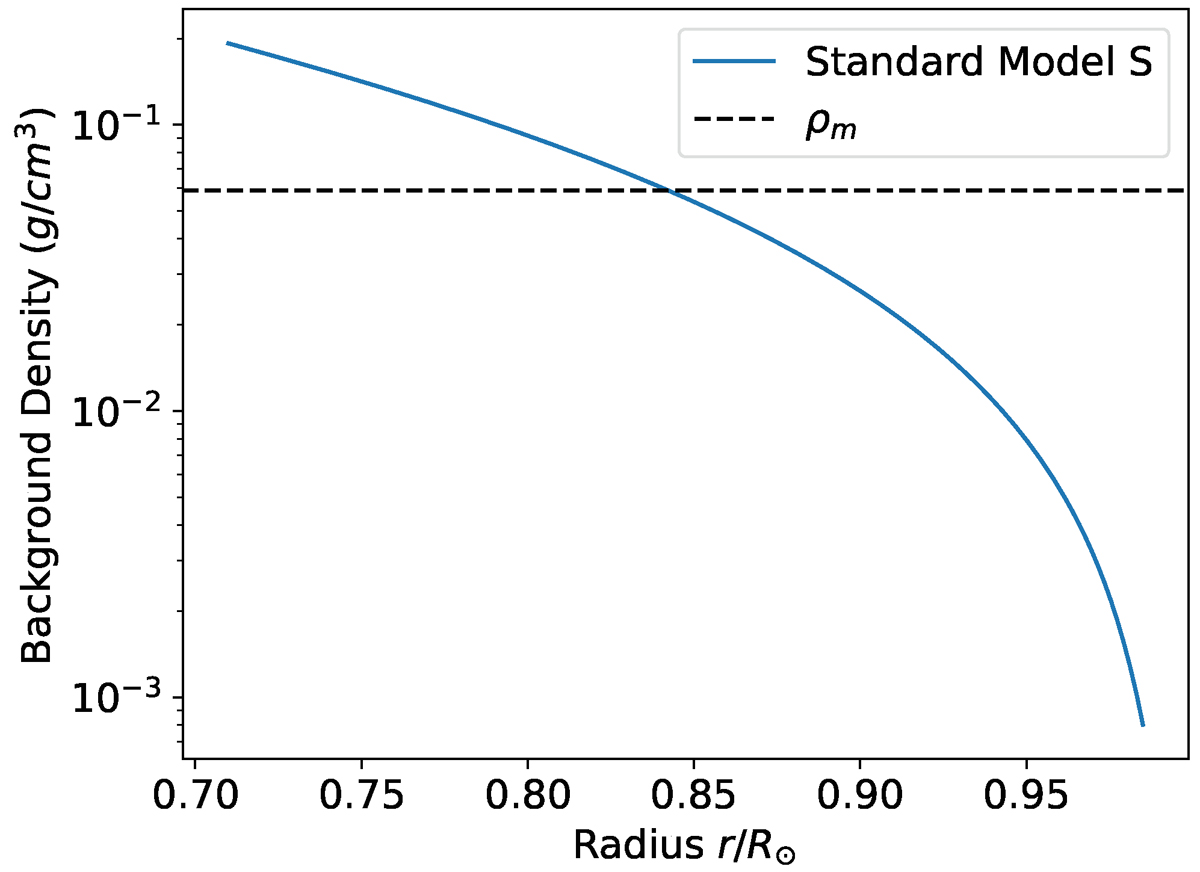
Variation of the background density in the solar convection zone from the standard model S (Christensen-Dalsgaard et al. 1996), denoted by the blue curve. The black dashed line shows the mean density ρm in the solar convection zone. The Boussinesq setup uses the mean density, whereas the other stratified setups use the density from model S.
Current usage metrics show cumulative count of Article Views (full-text article views including HTML views, PDF and ePub downloads, according to the available data) and Abstracts Views on Vision4Press platform.
Data correspond to usage on the plateform after 2015. The current usage metrics is available 48-96 hours after online publication and is updated daily on week days.
Initial download of the metrics may take a while.