Open Access
Fig. 7
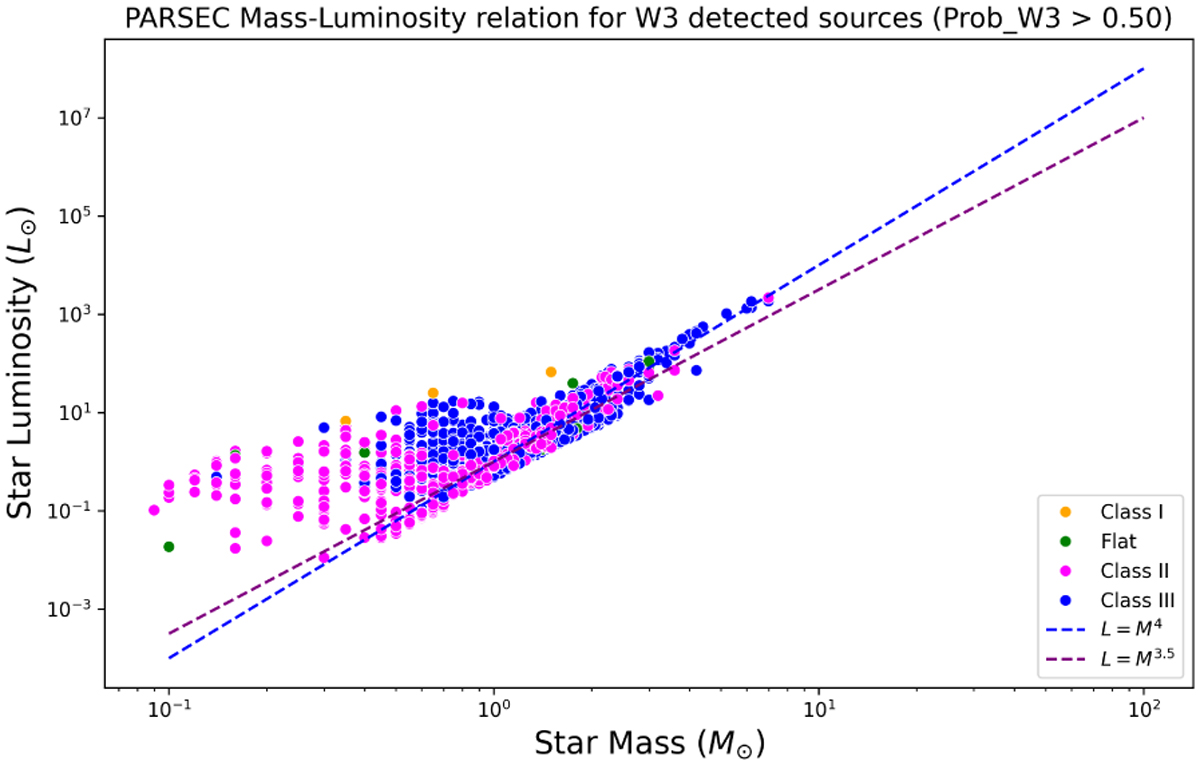
Download original image
Mass-luminosity plot is presented. This shows mass calculated from PARSEC evolutionary tracks (with solar metallicity) vs luminosity derived from the SED fitting of sources. The colours of the data points represent different classes.
Current usage metrics show cumulative count of Article Views (full-text article views including HTML views, PDF and ePub downloads, according to the available data) and Abstracts Views on Vision4Press platform.
Data correspond to usage on the plateform after 2015. The current usage metrics is available 48-96 hours after online publication and is updated daily on week days.
Initial download of the metrics may take a while.