Fig. 4
Download original image
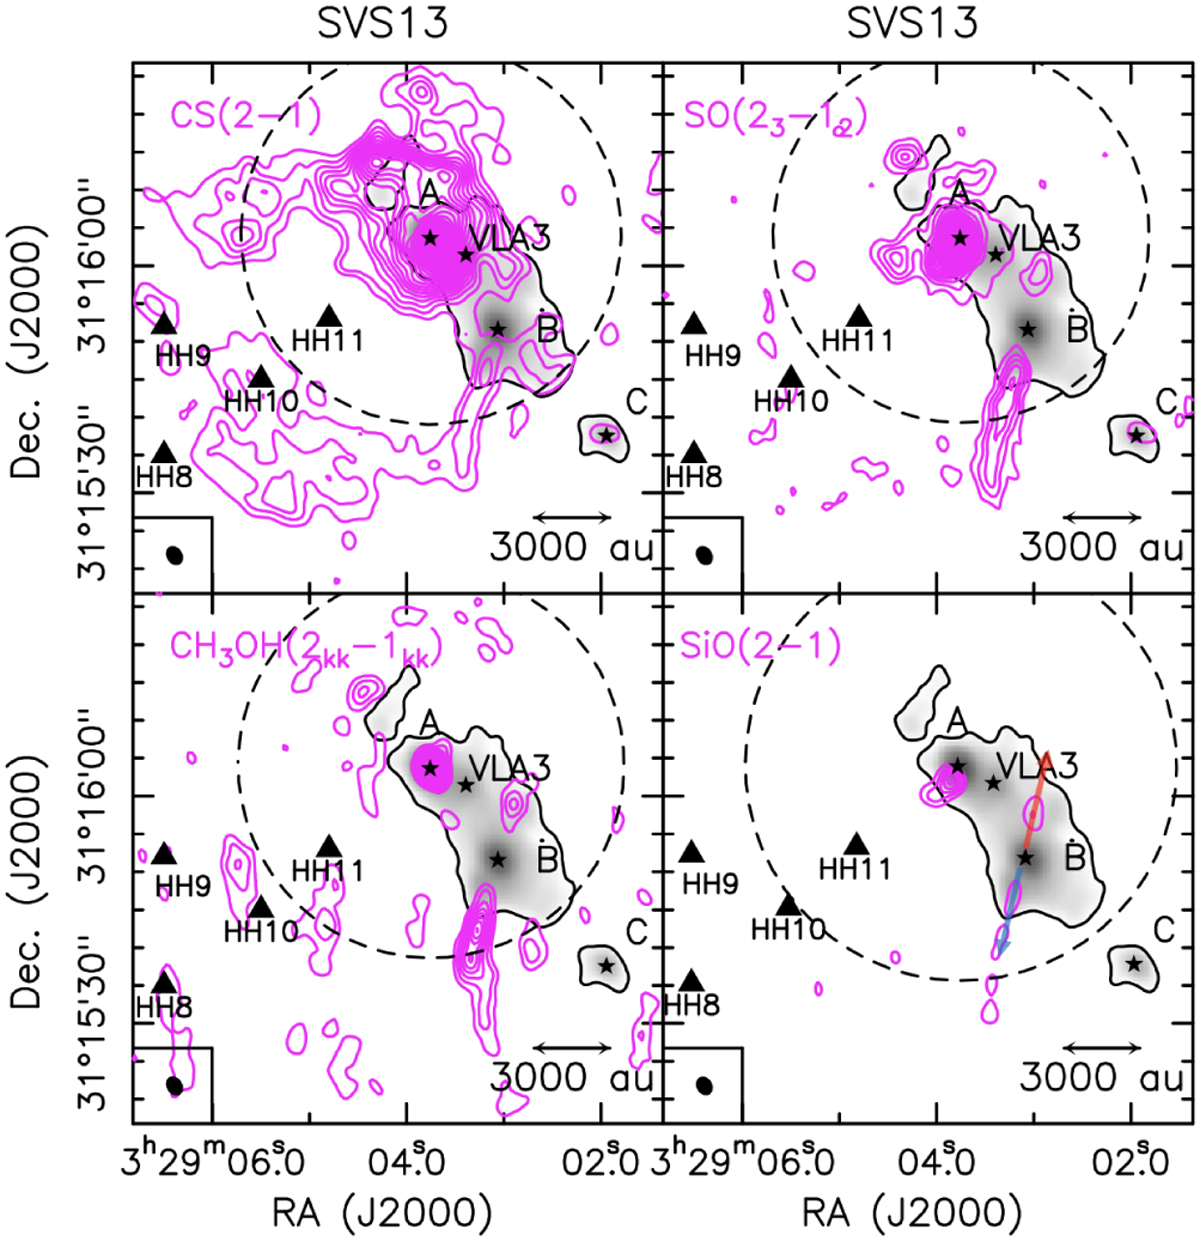
SVS13 multiple system as traced by the integrated-intensity map (moment 0, magenta contours) of CS(2–1) (top left), SO(23−12) (top right), CH3OH(2kk−1kk) (bottom-left), and SiO(2–1) (bottom-right). The methanol emission is due to the lines of the 2kk−1kk spectral pattern that is emitted at 96.7 GHz (see Table 1). The maps were obtained by integrating on the velocity ranges [–18.3, +6.1] km s−1(CS), [−106.3, +35.2] km s−1(SO), [−5.9, + 19.8] km s−1(CH3OH), and [−109.9, +48.9] km s−1(SiO). The first contours and steps are at 3σ (1σ= 16 mJy km s−1 beam −1 for CS, 20 mJy km s−1 beam −1 for SO, 12 mJy km s−1 beam −1 for CH3OH, and 27 mJy km s−1 beam−1 for SiO). We report the 3 mm continuum image in greyscale (and black contour, 3σ) (Fig. 1). The continuum peaks of the SVS13-A, VLA3, SVS13-B, and SVS13-C protostars are marked by black stars (Table 2). The synthesised beams are shown in the bottom-left corners, and the dashed circles delimitate the FoV of the images (Table 1). The black triangles indicate the positions of the HH8, HH9, HH10, and HH11 Herbig-Haro objects (e.g. Bally et al. 1996). The red and blue arrows in the bottom-right panel indicate the jet direction, as discussed in Sect. 5.3.
Current usage metrics show cumulative count of Article Views (full-text article views including HTML views, PDF and ePub downloads, according to the available data) and Abstracts Views on Vision4Press platform.
Data correspond to usage on the plateform after 2015. The current usage metrics is available 48-96 hours after online publication and is updated daily on week days.
Initial download of the metrics may take a while.