Fig. 3
Download original image
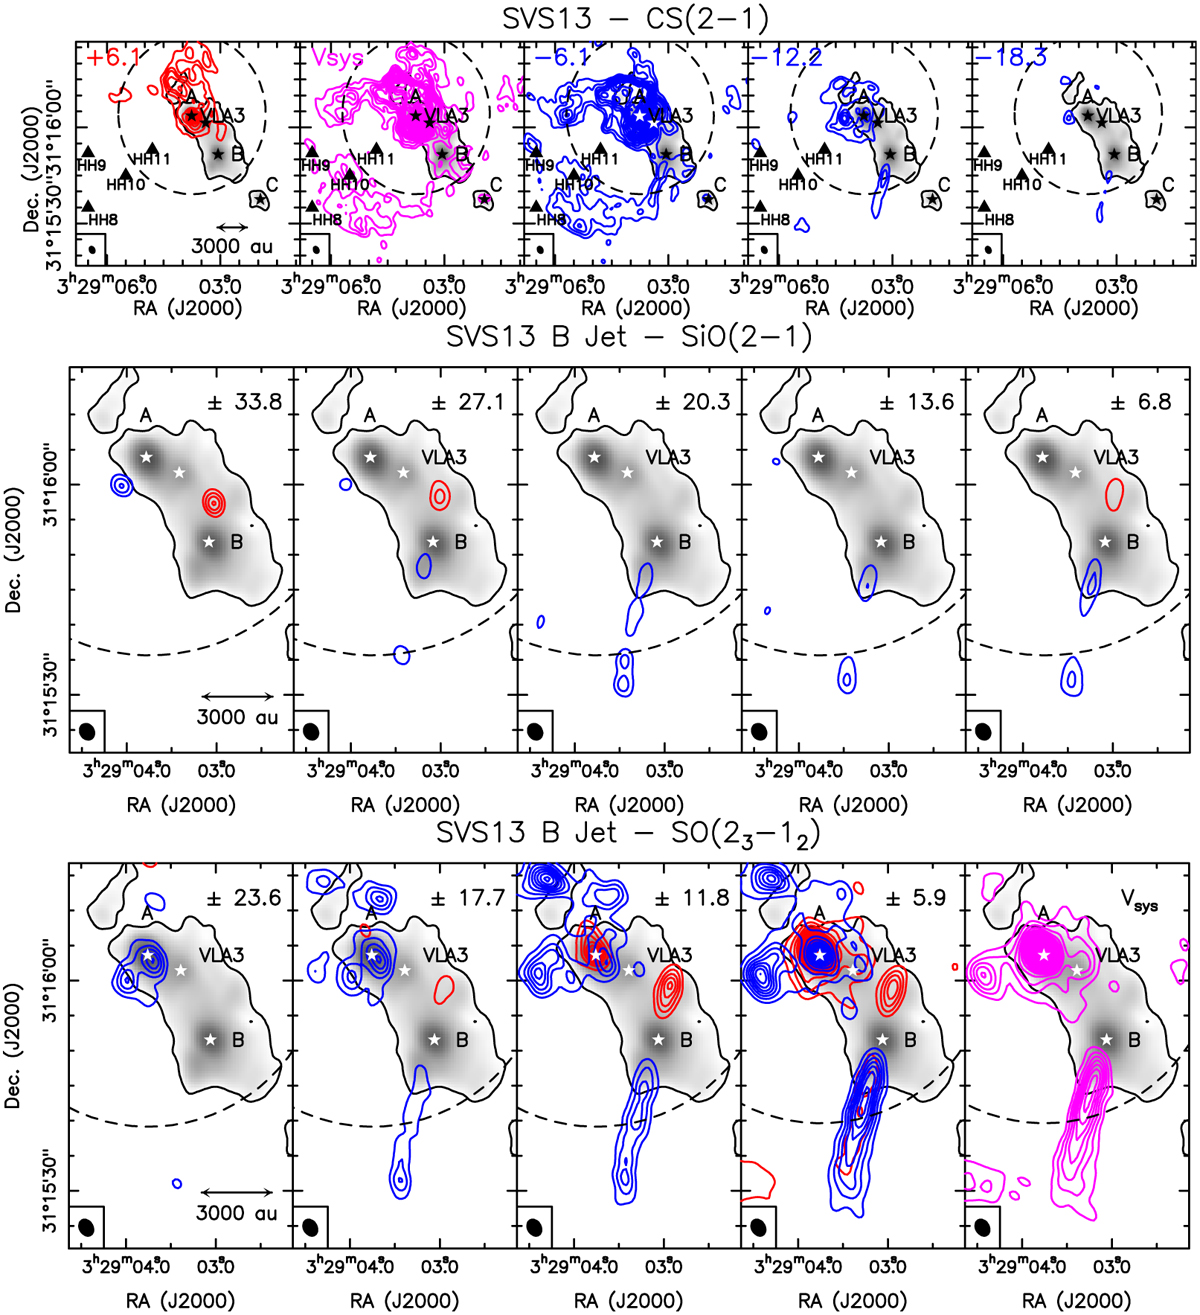
Channel maps of red- and blue-shifted emission from CS(2–1), SiO(2–1), and SO(66−55) (top, middle, and bottom panels, respectively). Magenta shows the systemic velocity (+8.5 km s−1, Podio et al. 2021). Each panel shows the emission shifted in velocity by the value given at the top. We show the 3 mm continuum image (Fig. 1) in greyscale (and black contours). The first contours and steps are 3σ (3.6 mJy beam−1, 2.4 mJy beam−1, and 2.1 mJy beam−1 for CS, SiO, and SO, respectively). The positions of the SVS13-A, VLA3, SVS13-B, and SVS13-C continuum peaks are marked by black or white stars (Table 2). The synthesised beams are shown in the bottom left panel, and the dashed circles delimitate the FoV (Table 1). The black triangles in the top panels indicate the positions of the HH8, HH9, HH10, and HH11 Herbig-Haro objects (e.g. Bally et al. 1996).
Current usage metrics show cumulative count of Article Views (full-text article views including HTML views, PDF and ePub downloads, according to the available data) and Abstracts Views on Vision4Press platform.
Data correspond to usage on the plateform after 2015. The current usage metrics is available 48-96 hours after online publication and is updated daily on week days.
Initial download of the metrics may take a while.