Fig. C.1
Download original image
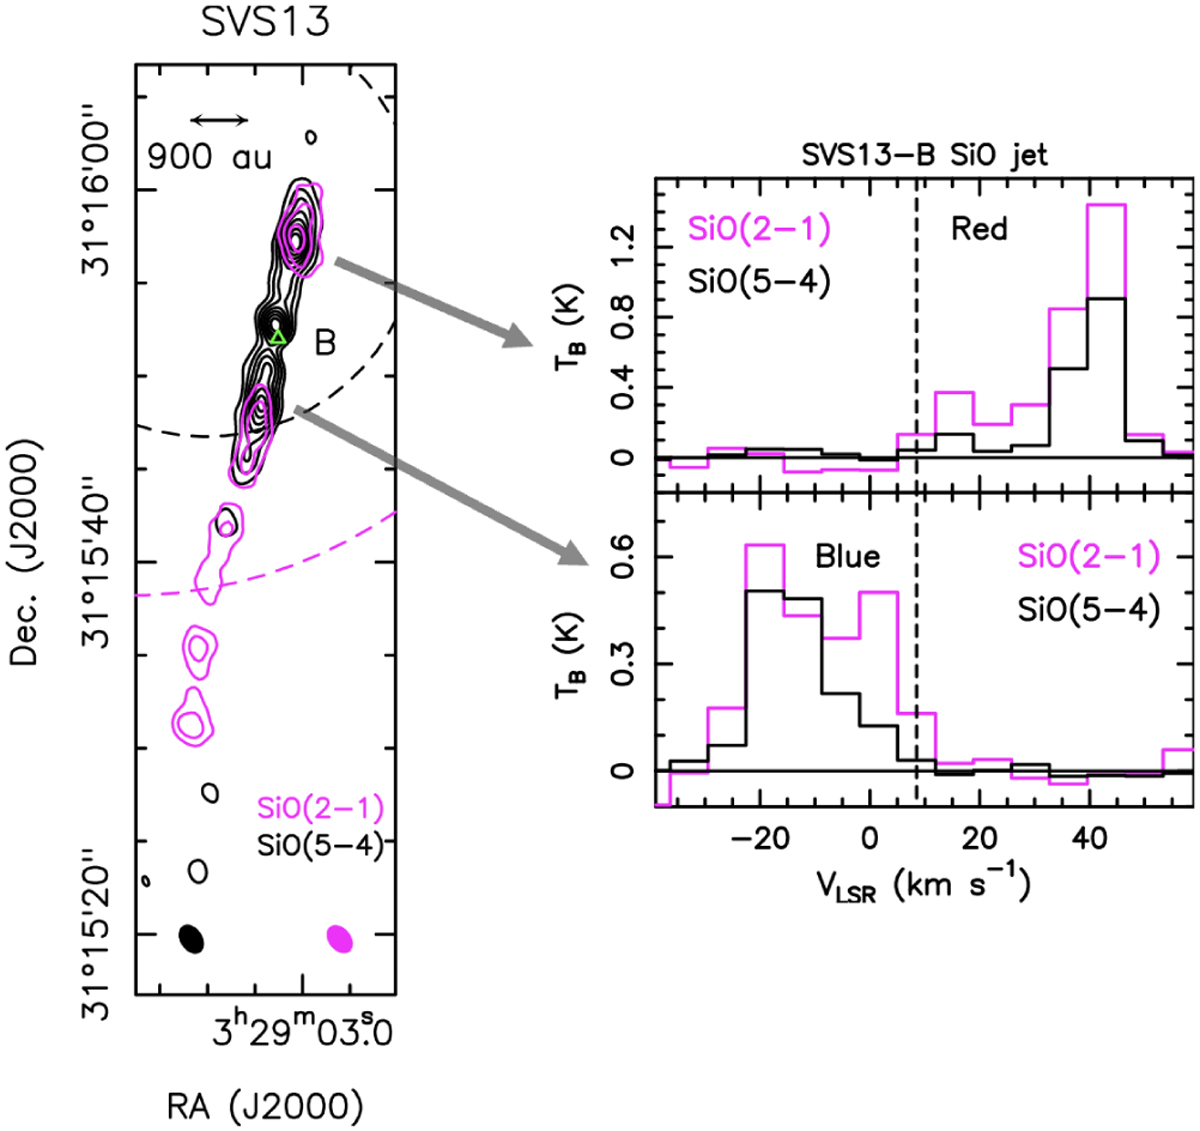
Left: The red- and blue-shifted bipolar SVS13-B SiO jet as traced by the J = 2–1 (magenta, this paper), J = 5–4 (black, from Podio et al. 2021). The SiO(5–4) image by Podio et al. (2021) has been smoothed to the spatial resolution of the present SiO(2–1) map (1″.72 × 1″.20,39∘). First contours and steps are 3σ (96 mJy km s−1 beam −1 for J = 2–1, and 75 mJy km s−1 beam−1 for J = 5–4), and 2σ, respectively. The synthesised beams are shown in the bottom-left corners. The dashed circles delimitate the FoV of the images. The position of the B continuum peak is marked by a green triangle (Table 2). Right: The SVS13-B jet: SiO(2–1) and SiO(5–4) line profiles, in brightness temperature scale, towards the SiO red- (Upper panel), and blue-shifted (Lower panel) emission peaks. The positions where the spectra have been extracetd are marked, in Fig. 6, by blue and red crosses. For SiO(2–1), the dataset with the beam of 1″.72 × 1″.20 has been used for a proper comparison with the SiO(5–4) data by Podio et al. (2021). The black vertical line at +8.5 km s−1 is for the systemic velocity.
Current usage metrics show cumulative count of Article Views (full-text article views including HTML views, PDF and ePub downloads, according to the available data) and Abstracts Views on Vision4Press platform.
Data correspond to usage on the plateform after 2015. The current usage metrics is available 48-96 hours after online publication and is updated daily on week days.
Initial download of the metrics may take a while.