Open Access
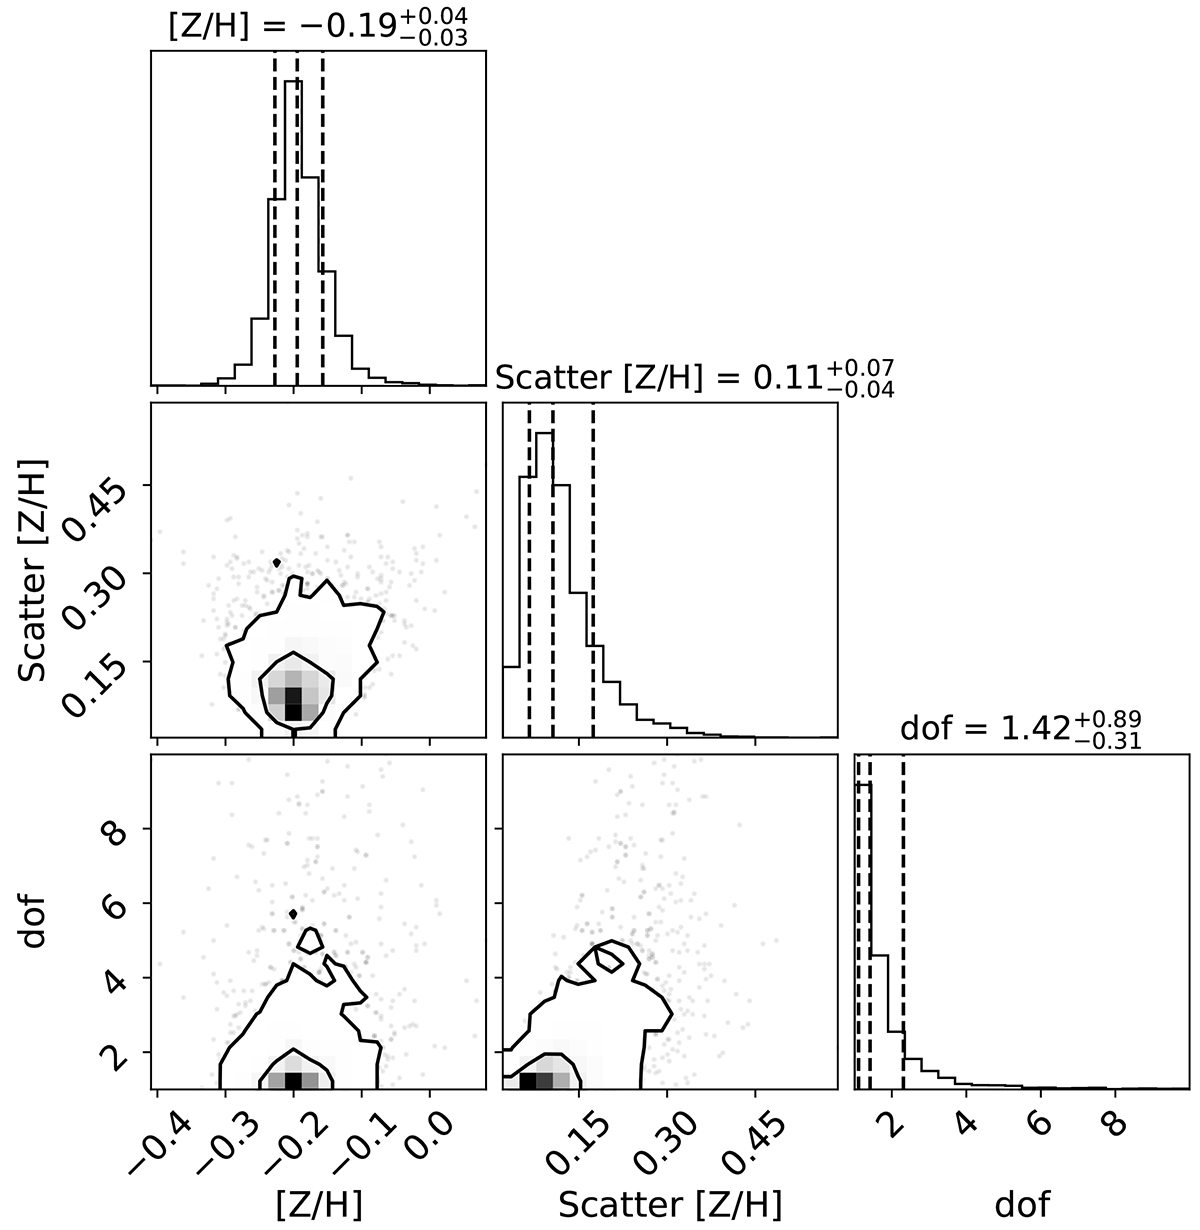
Fig. 6.
Download original image
Corner plot summary of the posterior distributions of the [Z/H], its scatter, and the degrees of freedom of the Student-t distribution obtained for the galaxies in the X-ray group environment bin. Contours are at the 68% and 95% probability levels. The 16%, 50%, and 84% intervals are indicated by dashed lines.
Current usage metrics show cumulative count of Article Views (full-text article views including HTML views, PDF and ePub downloads, according to the available data) and Abstracts Views on Vision4Press platform.
Data correspond to usage on the plateform after 2015. The current usage metrics is available 48-96 hours after online publication and is updated daily on week days.
Initial download of the metrics may take a while.