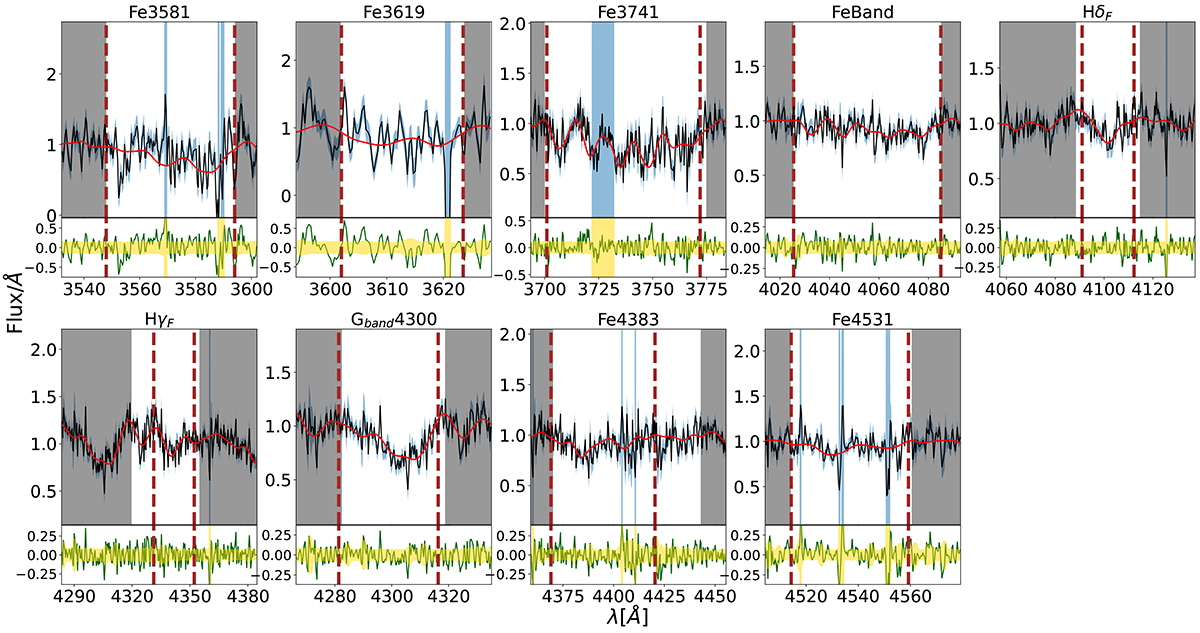
Fig. 3.
Download original image
FIF application to the indices available in the LEGA-C ID 209466 galaxy spectrum. The vertical dashed brown lines indicate the feature boundaries for each index, while the grey shaded regions represent the pseudo-continua used for normalisation. In the upper subplots, the black lines and blue shaded regions correspond to the observed spectrum and its associated uncertainty, respectively. The solid red line represents the best-fit derived from the posterior distribution. The green lines in the lower subplots show the residuals between the observed spectrum and the best fit, with the yellow shaded region indicating the relative uncertainties of the observed spectrum.
Current usage metrics show cumulative count of Article Views (full-text article views including HTML views, PDF and ePub downloads, according to the available data) and Abstracts Views on Vision4Press platform.
Data correspond to usage on the plateform after 2015. The current usage metrics is available 48-96 hours after online publication and is updated daily on week days.
Initial download of the metrics may take a while.