Fig. 4
Download original image
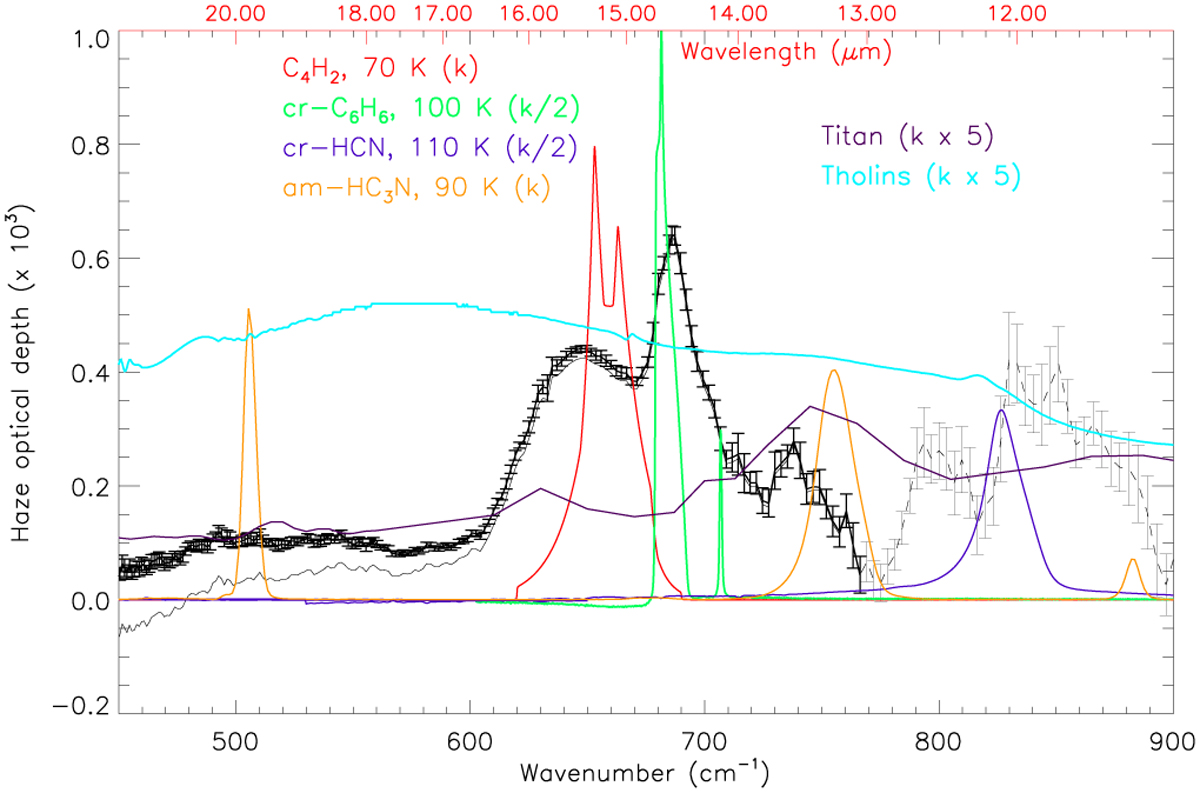
Haze optical depth (multiplied by 103), compared to imaginary refractive indices of several plausible icy compounds at relevant temperatures. The solid thick line with 2-σ error bars corresponds to the haze optical depth inferred by using the CH4 seasonal surface temperature model. The thin solid line, which diverges from the previous one longward of 15 μm, makes use of the diurnal-only surface temperature model. References are Moore et al. (2010) for HCN, Ugelow & Anderson (2022) for HC3N, Hudson & Yarnall (2022) for C6H6 and Khanna et al. (1988) for C4H2. Also shown are the imaginary refractive indices of Titan’s haze (Vinatier et al. 2012) and of Titan’s tholin analogues (Imanaka et al. 2012). The retrieved haze optical depth is unreliable shortwards of ~13 μm (thin dashed line).
Current usage metrics show cumulative count of Article Views (full-text article views including HTML views, PDF and ePub downloads, according to the available data) and Abstracts Views on Vision4Press platform.
Data correspond to usage on the plateform after 2015. The current usage metrics is available 48-96 hours after online publication and is updated daily on week days.
Initial download of the metrics may take a while.