Fig. 3
Download original image
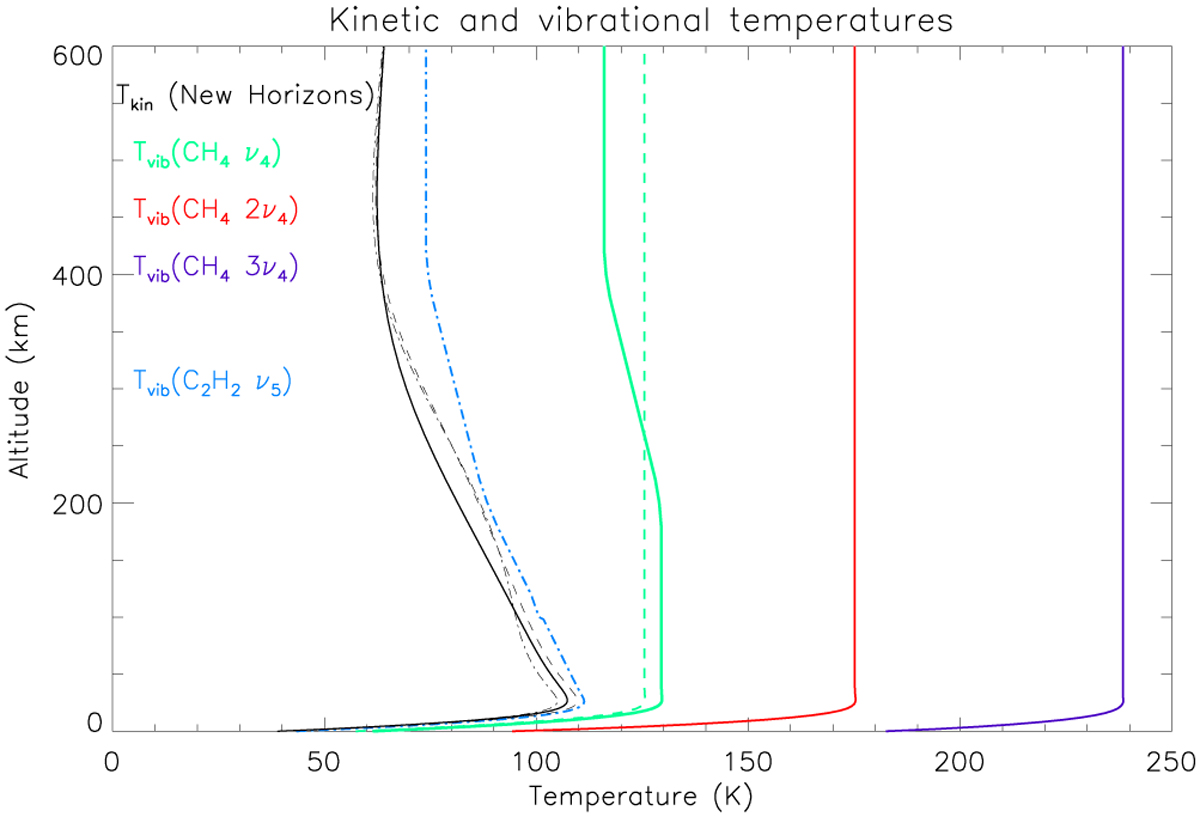
Pluto’s kinetic temperature profile from New Horizons (Tkin, solid black line) and inferred vibrational temperature profiles for CH4, CH3D, and C2H2, color-coded by band. For CH4, Tvib for the fundamental (ν4) and first two overtone (2ν4 and 3ν4) levels, are shown. The dashed green curve is an alternative Tvib profile for the ν4 level which does not satisfy observations (see Fig. A.2, top panel). The solid green curve (nominal Tvib) for the ν4 CH4 band was also used for calculating the CH3D ν6 emission. The dashed-dotted light blue curve is the retrieved Tvib for the ν5 band of C2H2, assuming the C2H2 Lavvas et al. (2021) vertical profile. The black dashed-dotted and dotted lines are the equatorial and north polar kinetic temperature profiles retrieved by Lellouch et al. (2022) from ALMA 2017 observations.
Current usage metrics show cumulative count of Article Views (full-text article views including HTML views, PDF and ePub downloads, according to the available data) and Abstracts Views on Vision4Press platform.
Data correspond to usage on the plateform after 2015. The current usage metrics is available 48-96 hours after online publication and is updated daily on week days.
Initial download of the metrics may take a while.