Fig. 2
Download original image
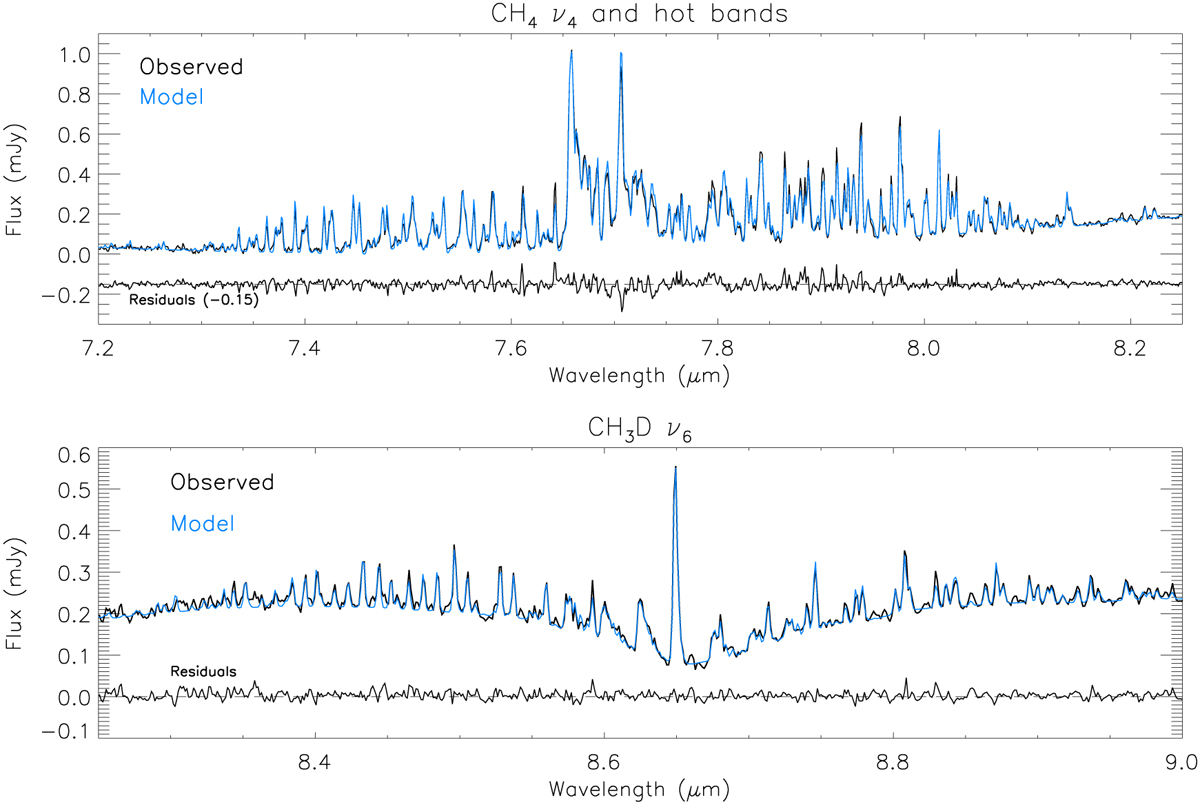
CH4 and CH3D fluorescence. Observations (in black) are compared to best model fits (in blue). The model includes contributions from the ν4, 2ν4–ν4, and 3ν4–2ν4 bands of CH4, and from the ν6 and ν3 bands of CH3D (see text and Appendix A for details), as well as a solar reflected component with the I/F reflectivity shown in Fig. 1. CH4 and 13CH4 (resp. CH3D) entirely dominate the emission in the upper (lower) panels.
Current usage metrics show cumulative count of Article Views (full-text article views including HTML views, PDF and ePub downloads, according to the available data) and Abstracts Views on Vision4Press platform.
Data correspond to usage on the plateform after 2015. The current usage metrics is available 48-96 hours after online publication and is updated daily on week days.
Initial download of the metrics may take a while.