Fig. C.1
Download original image
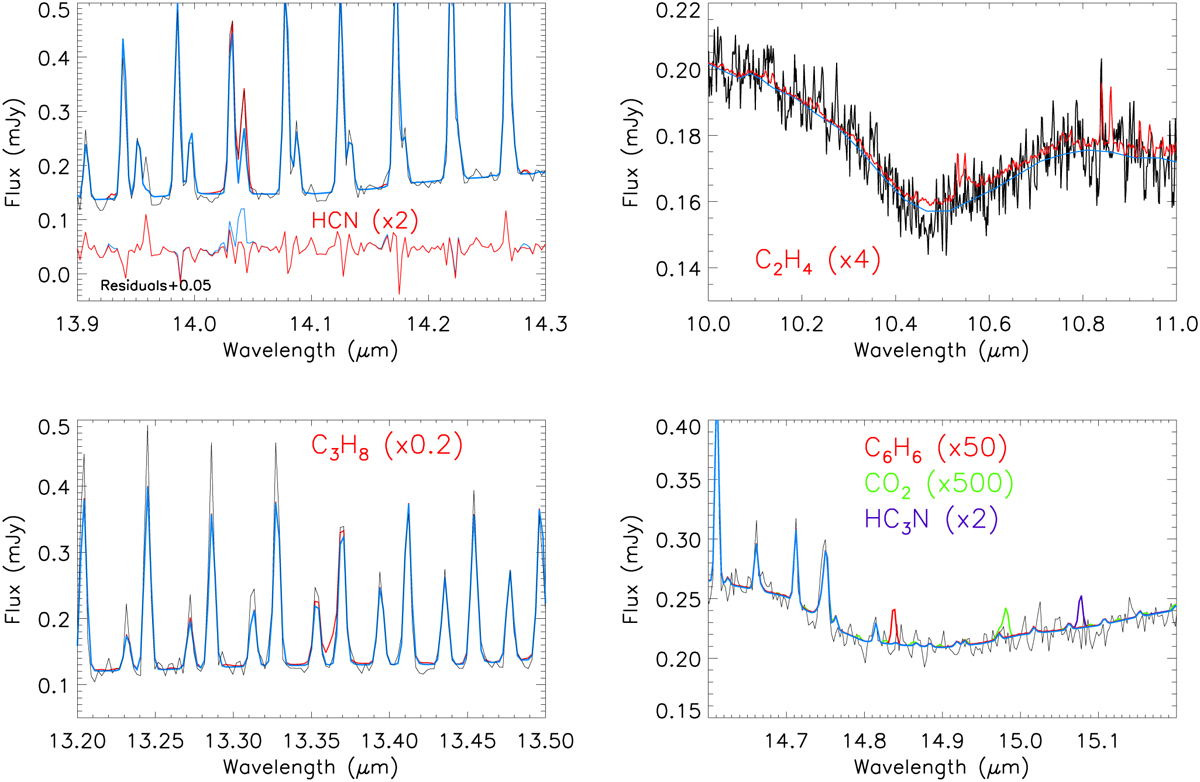
Tentative detection of HCN and upper limits on C2H4, C3H8, C6H6, CO2, and HC3N. For each species, the number in parentheses indicates the factor by which the nominal profile from Lavvas et al. (2021) has been multiplied. In all panels, model excluding (resp. including) the considered species is shown in blue (resp. in red). In the first panel (HCN), observation minus model residuals are also shown.
Current usage metrics show cumulative count of Article Views (full-text article views including HTML views, PDF and ePub downloads, according to the available data) and Abstracts Views on Vision4Press platform.
Data correspond to usage on the plateform after 2015. The current usage metrics is available 48-96 hours after online publication and is updated daily on week days.
Initial download of the metrics may take a while.