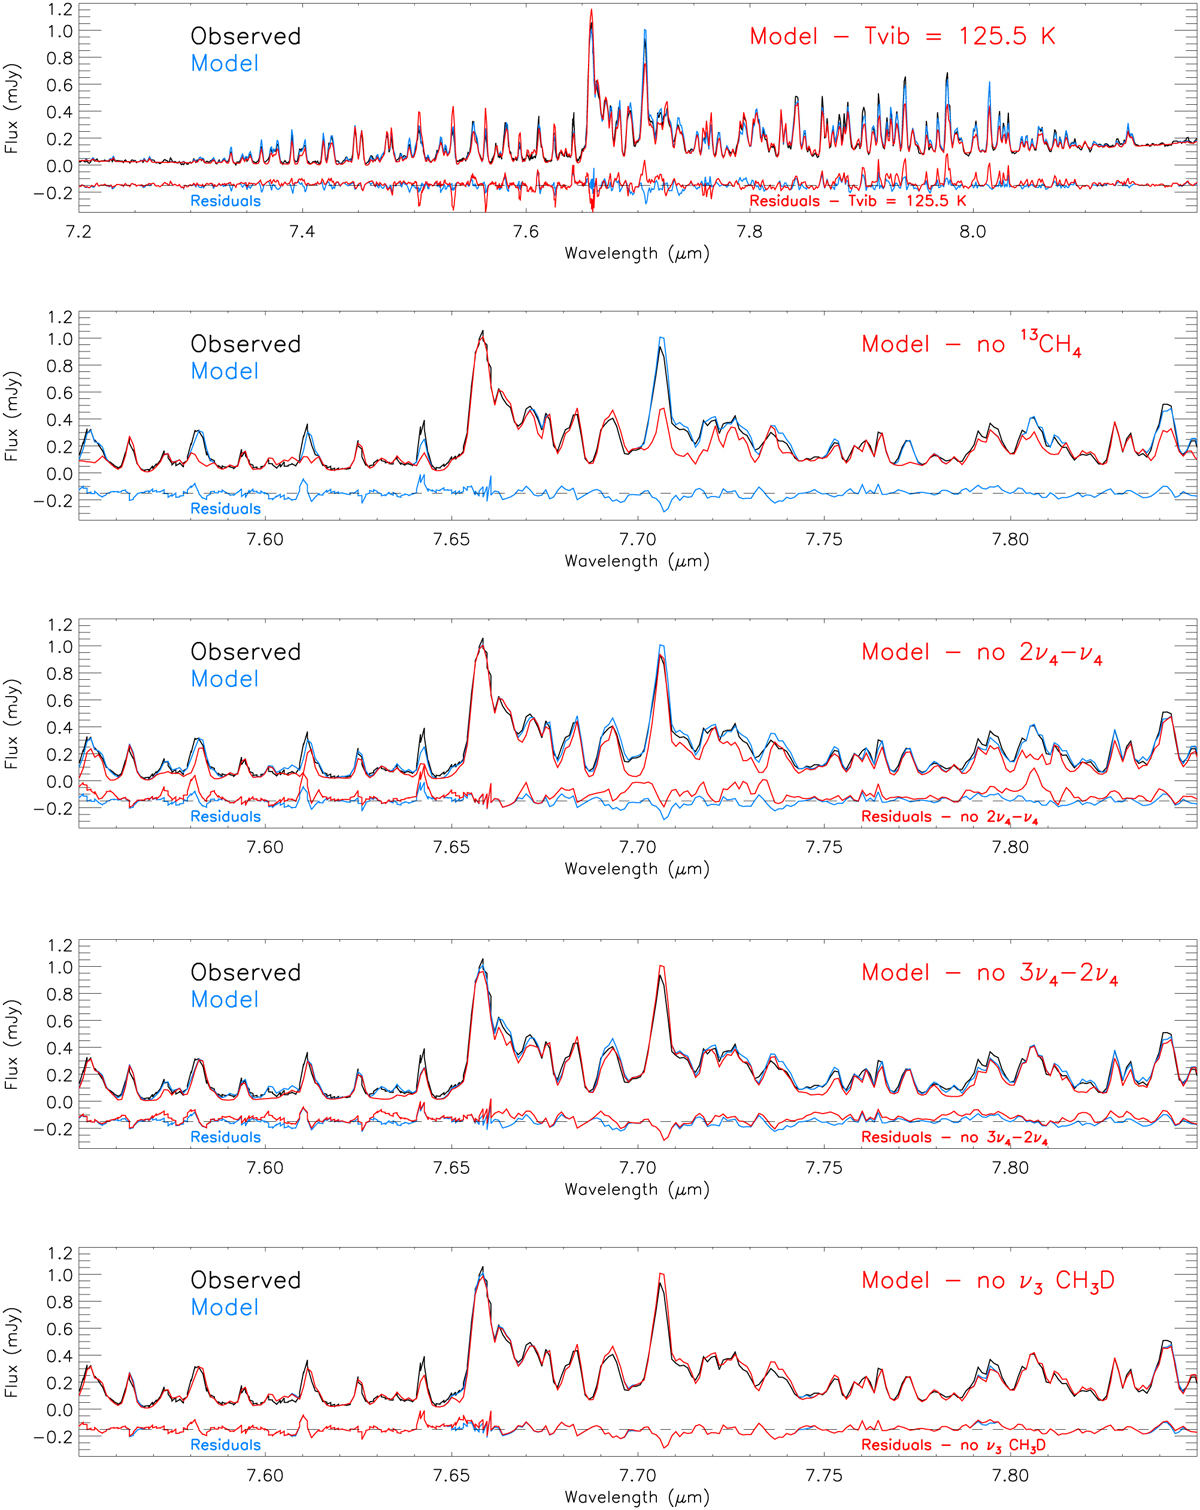
Fig. A.2
Download original image
Model sensitivity for the CH4 fluorescence in some selected spectral intervals. Top panel: sensitivity to Tvib (ν4) profile (non-isothermal above 25 km vs isothermal at 125.5 K). Other panels: sensitivity to model omitting individual fluorescence contributions one-by-one: 13CH4, 2ν4–ν4, 3ν4–2ν4, CH3D ν3. In each panel, the nominal model including all contributions is shown in blue, and the alternative model in red.
Current usage metrics show cumulative count of Article Views (full-text article views including HTML views, PDF and ePub downloads, according to the available data) and Abstracts Views on Vision4Press platform.
Data correspond to usage on the plateform after 2015. The current usage metrics is available 48-96 hours after online publication and is updated daily on week days.
Initial download of the metrics may take a while.