Open Access
Fig. B.1.
Download original image
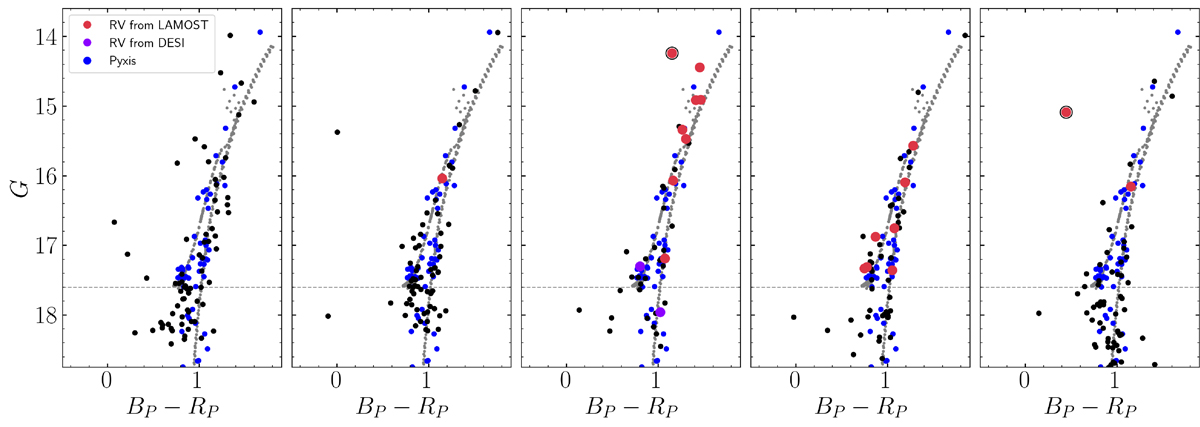
The distribution of the member stars in the color magnitude diagram, BP − RP versus G within different longitude ϕ1 ranges. The common stars with LAMOST and DESI are marked with red and magenta dots, respectively. The horizontal dashed line in each panel represents G = 17.6 for testing the distance gradient.
Current usage metrics show cumulative count of Article Views (full-text article views including HTML views, PDF and ePub downloads, according to the available data) and Abstracts Views on Vision4Press platform.
Data correspond to usage on the plateform after 2015. The current usage metrics is available 48-96 hours after online publication and is updated daily on week days.
Initial download of the metrics may take a while.