Fig. 5
Download original image
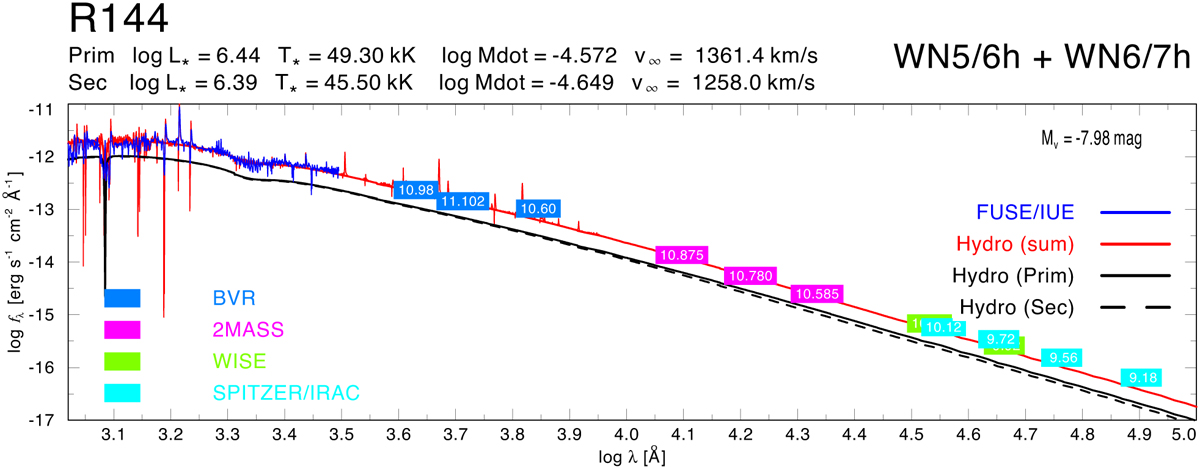
Spectral energy distribution of the R144 binary star system with FUSE/IUE data (blue line), and BVR photometry in the optical and 2MASS, WISE, and SPITZER/IRAC photometry in the infra-red. The red line represents the reddened synthetic spectral energy distribution from our best-fit model. The black solid and dashed lines correspond to the individual contributions from the primary and secondary stars, respectively.
Current usage metrics show cumulative count of Article Views (full-text article views including HTML views, PDF and ePub downloads, according to the available data) and Abstracts Views on Vision4Press platform.
Data correspond to usage on the plateform after 2015. The current usage metrics is available 48-96 hours after online publication and is updated daily on week days.
Initial download of the metrics may take a while.