Fig. 3
Download original image
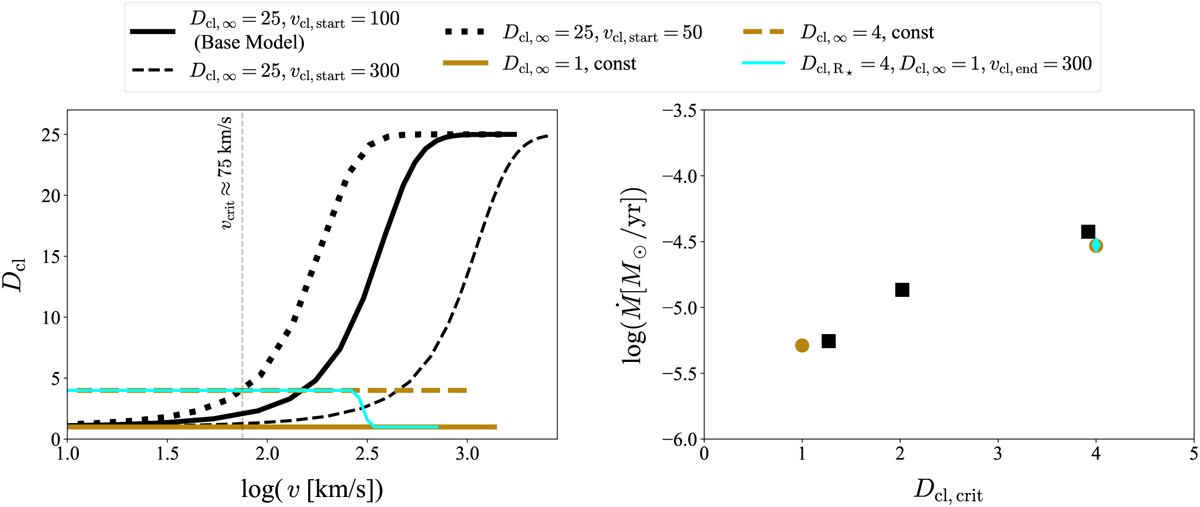
Different stratifications of micro-clumping tested in our hydrodynamic atmosphere models. Left: the black solid, dashed, and dotted lines represent clumping stratifications that increase outward, while the cyan line depicts clumping that decreases outward. The brown solid, dashed, and dotted lines represent constant clumping throughout the atmosphere. The grey dashed vertical line indicates the velocity at the critical radius which is roughly vcrit ≈ 75 km s−1 for all the models tested here. Right: the predicted mass-loss rate as a function of the clumping value at the critical point.
Current usage metrics show cumulative count of Article Views (full-text article views including HTML views, PDF and ePub downloads, according to the available data) and Abstracts Views on Vision4Press platform.
Data correspond to usage on the plateform after 2015. The current usage metrics is available 48-96 hours after online publication and is updated daily on week days.
Initial download of the metrics may take a while.