Fig. 2
Download original image
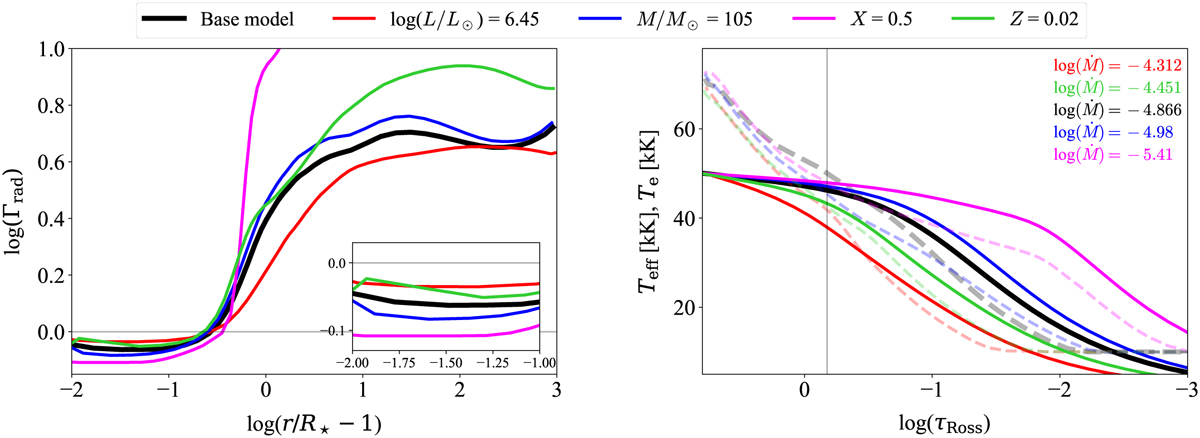
Left: radiative acceleration normalised to gravity. Right: effective temperature (solid) and electron temperature (dashed) stratification for specific models from Fig. 1. The grey horizontal line in the left panel is the radiative Eddington limit, Γrad = 1. The inset plot in the left panel shows the zoom-in of the sub-critical region. The grey vertical line in the right panel is marked at τRoss = 2/3. In both panels, the black solid line represents the base model, while the coloured solid lines indicate models where each of the following parameter is varied from the ‘base model’: L (red), M (blue), X (magenta), and Z (green).
Current usage metrics show cumulative count of Article Views (full-text article views including HTML views, PDF and ePub downloads, according to the available data) and Abstracts Views on Vision4Press platform.
Data correspond to usage on the plateform after 2015. The current usage metrics is available 48-96 hours after online publication and is updated daily on week days.
Initial download of the metrics may take a while.