Open Access
Fig. B.3
Download original image
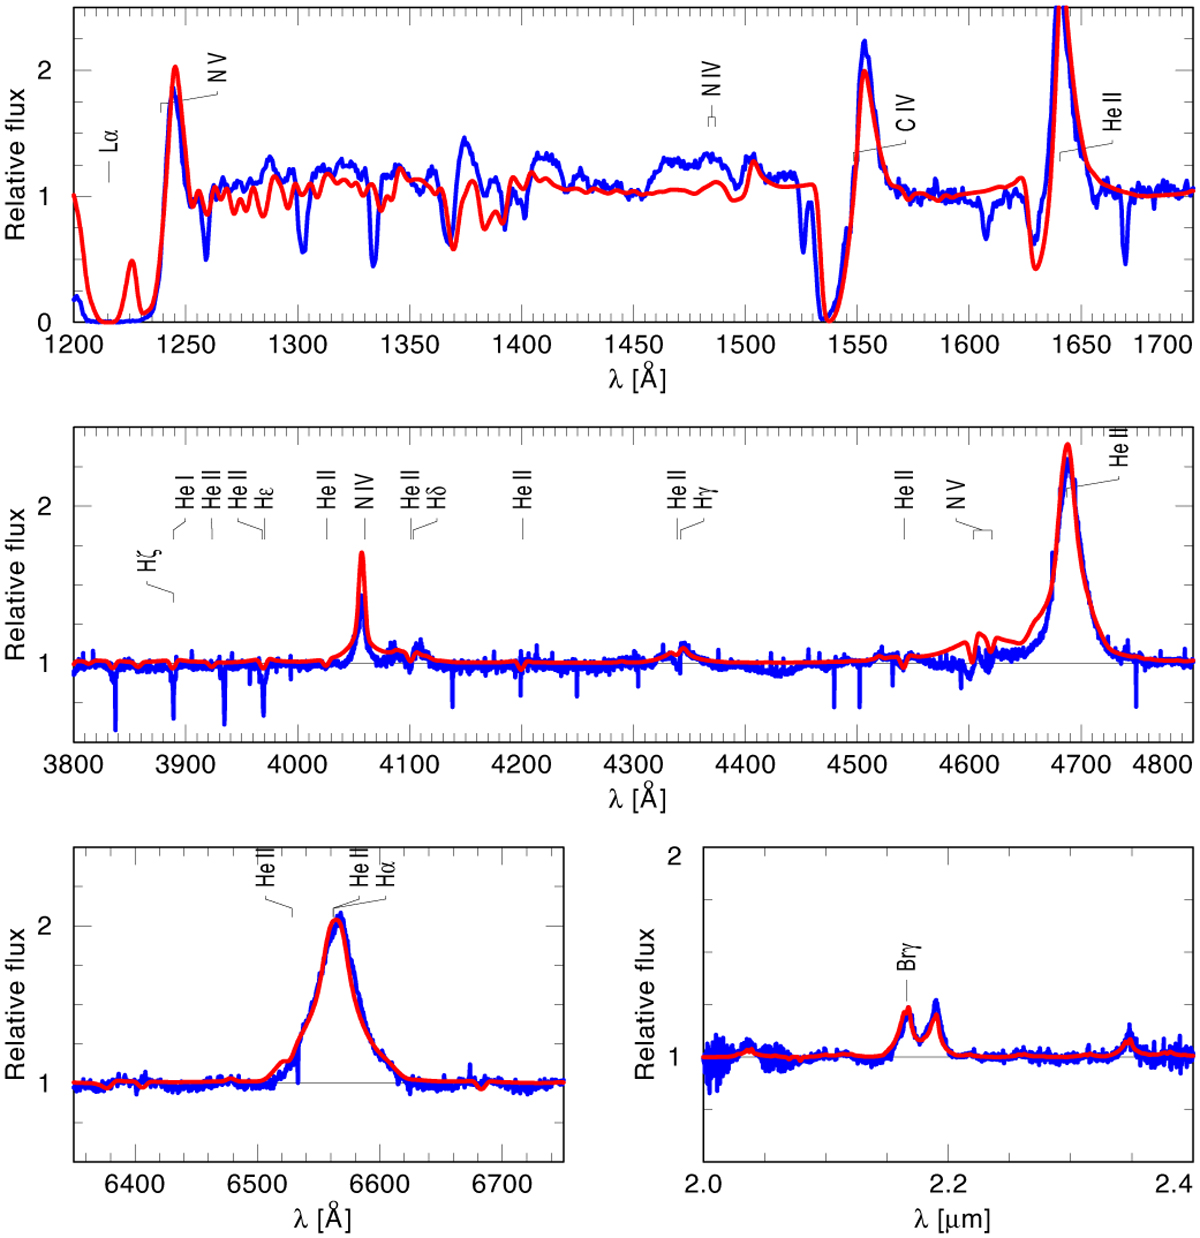
Normalised far-UV HST-STIS/G140L, optical HST-STIS/G430M, Hα G750M and K-band VLT/SINFONI observations (blue line), which is compared to the synthetic composite spectra from our best-fit fixed-M R136a1 model with vturb = 100 km s−1 (red line).
Current usage metrics show cumulative count of Article Views (full-text article views including HTML views, PDF and ePub downloads, according to the available data) and Abstracts Views on Vision4Press platform.
Data correspond to usage on the plateform after 2015. The current usage metrics is available 48-96 hours after online publication and is updated daily on week days.
Initial download of the metrics may take a while.