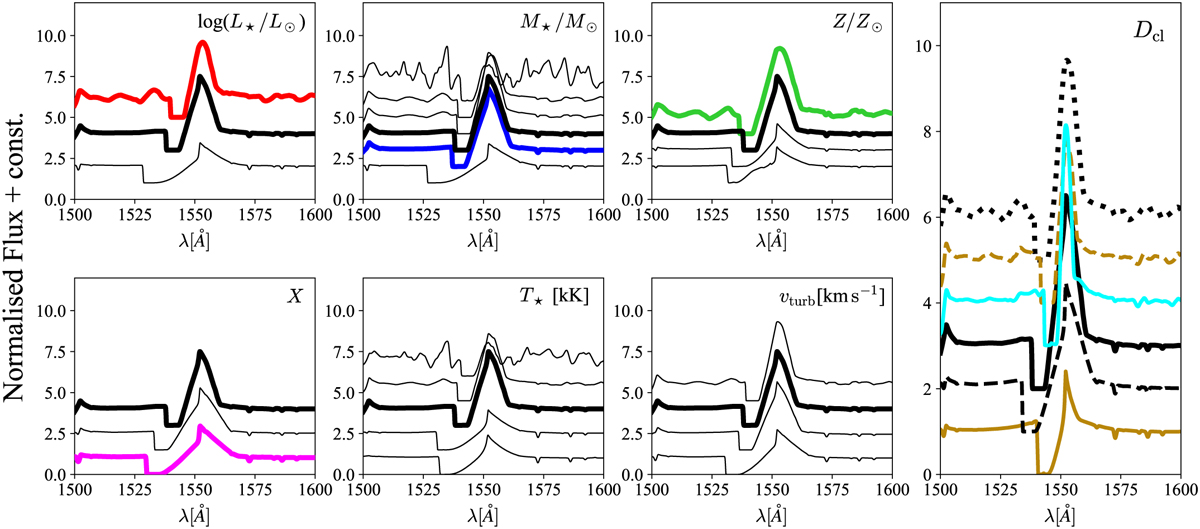
Fig. A.2
Download original image
Synthetic C IV λ1550 P-Cygni line from hydrodynamic atmosphere models. The black solid line represents the ‘base model’ from Sect. 4. Each sub-plot illustrates the effect of individually varying input parameters (shown in top left corner) on the width of the synthetic C IV λ1550 line. The colour scheme corresponds to Figs. 1 and 3.
Current usage metrics show cumulative count of Article Views (full-text article views including HTML views, PDF and ePub downloads, according to the available data) and Abstracts Views on Vision4Press platform.
Data correspond to usage on the plateform after 2015. The current usage metrics is available 48-96 hours after online publication and is updated daily on week days.
Initial download of the metrics may take a while.