Fig. 8.
Download original image
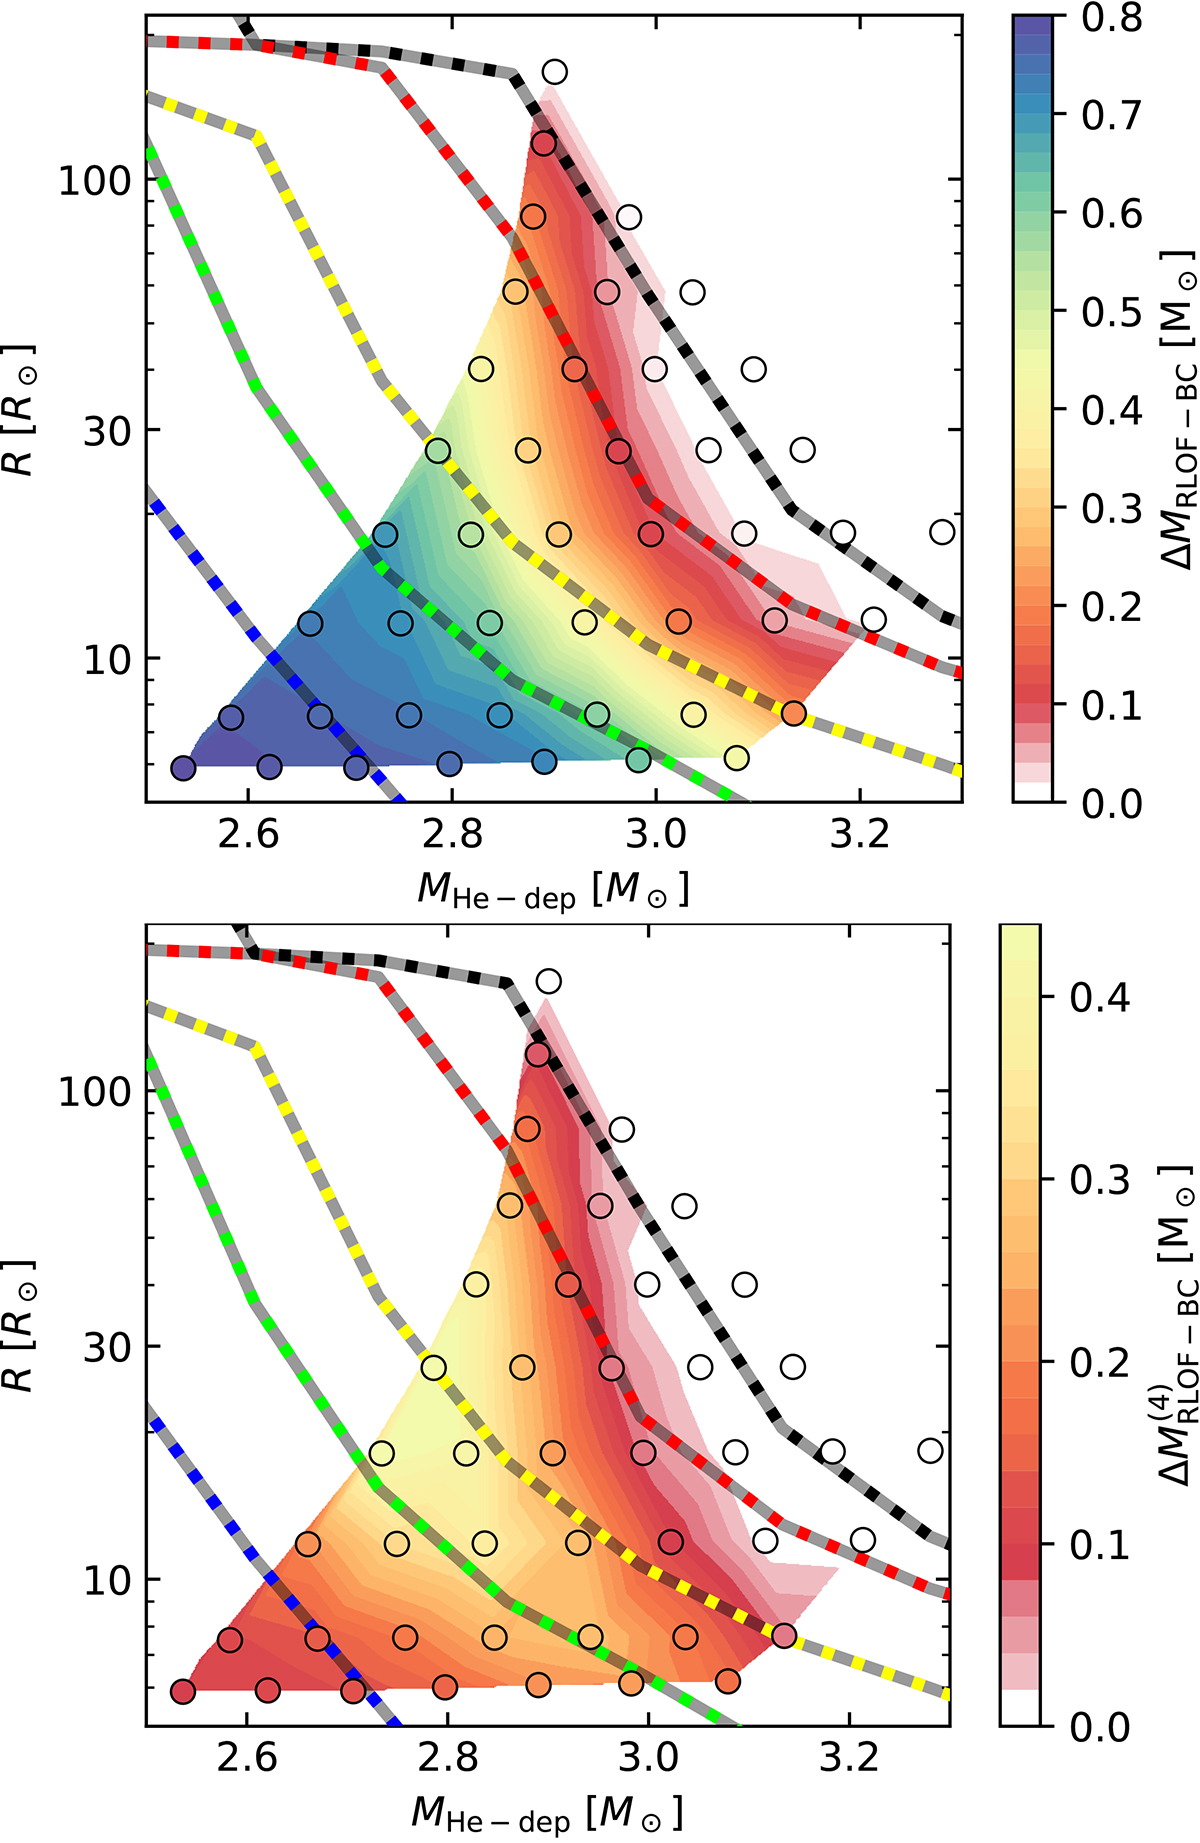
Maps showing the ΔMRLOF−BC (top) and the amount lost after ṀROLF exceeds 10−4 M⊙ yr−1 (i.e., ![]() , bottom) in the MHe−dep−RRL, 1 diagram. The scatter highlight the models, and the map is linearly interpolated between them. The dashed curves correspond to the radii of single HeS models as a function of mass at different times before the end of the run (20 kyr in blue, 10 kyr in green, 5 kyr in yellow, 1 kyr in red and 1 yr in black; see Fig. 2).
, bottom) in the MHe−dep−RRL, 1 diagram. The scatter highlight the models, and the map is linearly interpolated between them. The dashed curves correspond to the radii of single HeS models as a function of mass at different times before the end of the run (20 kyr in blue, 10 kyr in green, 5 kyr in yellow, 1 kyr in red and 1 yr in black; see Fig. 2).
Current usage metrics show cumulative count of Article Views (full-text article views including HTML views, PDF and ePub downloads, according to the available data) and Abstracts Views on Vision4Press platform.
Data correspond to usage on the plateform after 2015. The current usage metrics is available 48-96 hours after online publication and is updated daily on week days.
Initial download of the metrics may take a while.