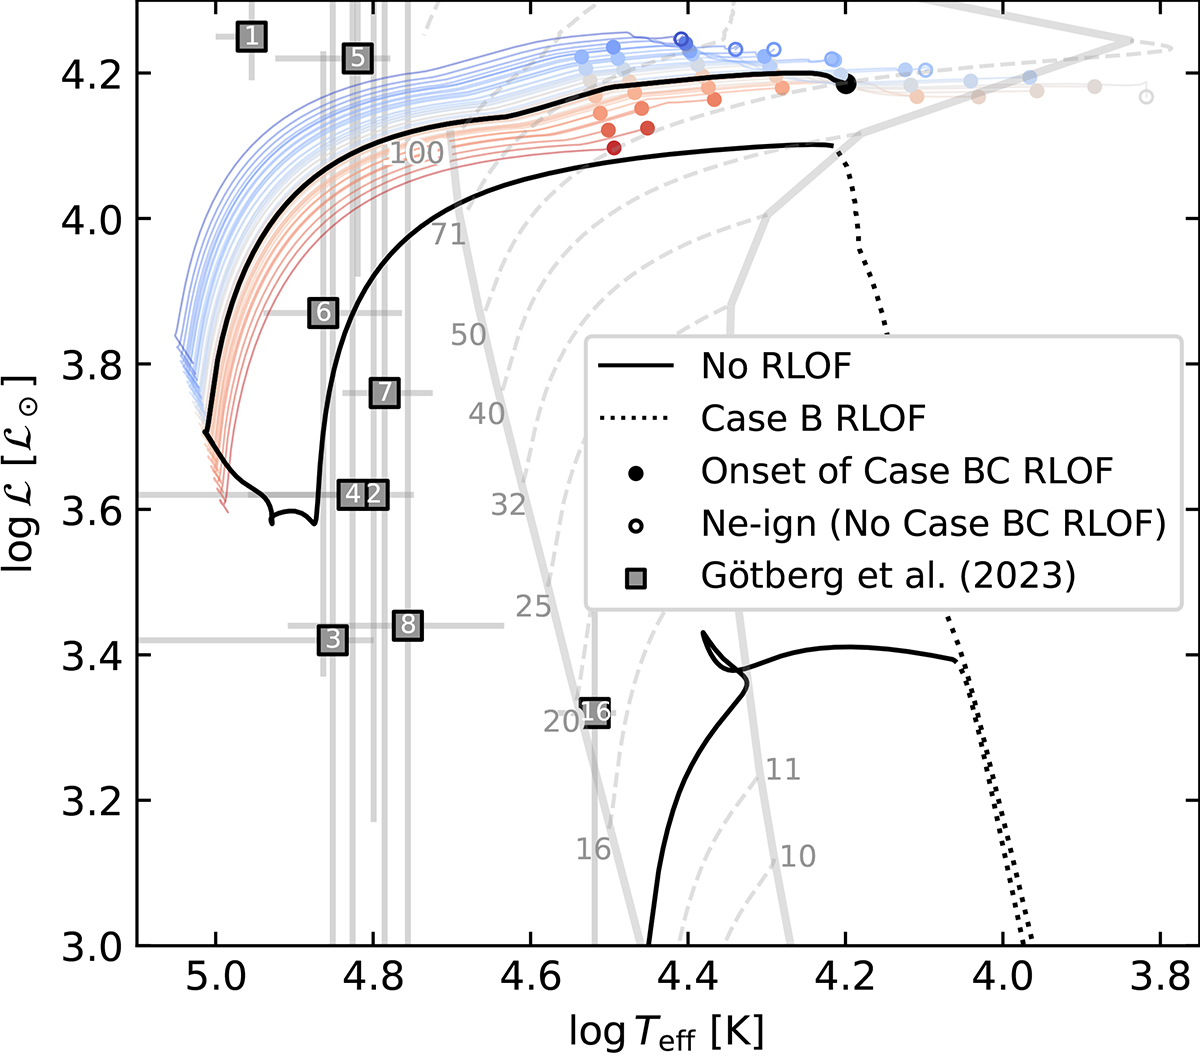
Fig. 6.
Download original image
Spectroscopic HR-diagram of the binary-stripped models explored in this work. The models are color-coded by the mass at core He-depletion MHe−dep (see Fig. 3). Each track is plotted from the end of core He-burning until the onset of Case BC RLOF (filled circle). For those that do not undergo RLOF, the plot is shown until the point found at 20 yr before the end of the run (empty circle). The track of model B13.5p6.3 is highlighted in black and shown from ZAMS. The He-stars in the Small and Large Magellanic Clouds analyzed by and Götberg et al. (2023) are also shown (black squares), and numbered as in Drout et al. (2023).
Current usage metrics show cumulative count of Article Views (full-text article views including HTML views, PDF and ePub downloads, according to the available data) and Abstracts Views on Vision4Press platform.
Data correspond to usage on the plateform after 2015. The current usage metrics is available 48-96 hours after online publication and is updated daily on week days.
Initial download of the metrics may take a while.