Fig. 4.
Download original image
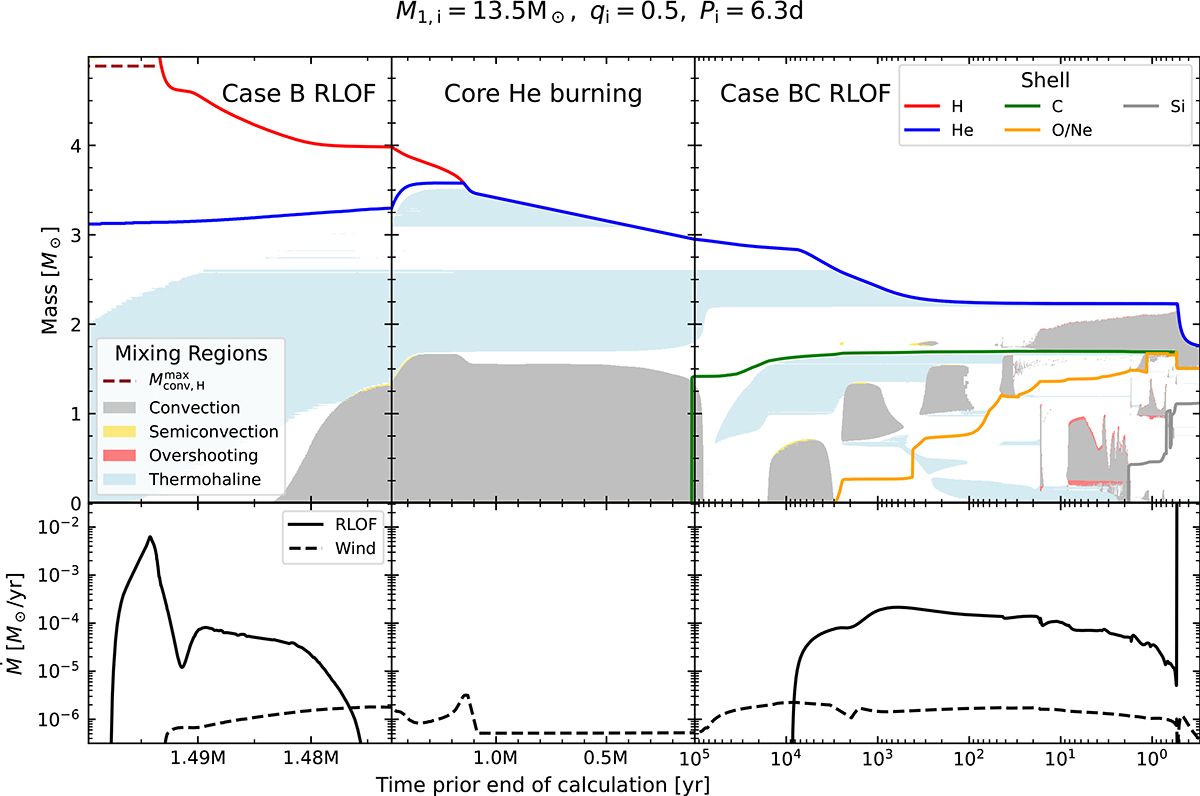
Time evolution of the primary star in model M1, i = 13.5 M⊙, qi = 0.50, and Pi = 6.3 d from the onset of Case B RLOF (left), during core He burning (center), and until the end of the run (right). Top: Kippenhahn diagram. The outermost boundaries are colored corresponding to the most abundant element just below (see legend on the right), and the colored patches are based on the dominating mixing mechanism (see legend on the left). A dashed red line shows the maximum extent of the convective H-burning core during the MS. Bottom: Mass transfer rate (solid) and wind mass loss rate from the primary (dashed).
Current usage metrics show cumulative count of Article Views (full-text article views including HTML views, PDF and ePub downloads, according to the available data) and Abstracts Views on Vision4Press platform.
Data correspond to usage on the plateform after 2015. The current usage metrics is available 48-96 hours after online publication and is updated daily on week days.
Initial download of the metrics may take a while.