Fig. 3.
Download original image
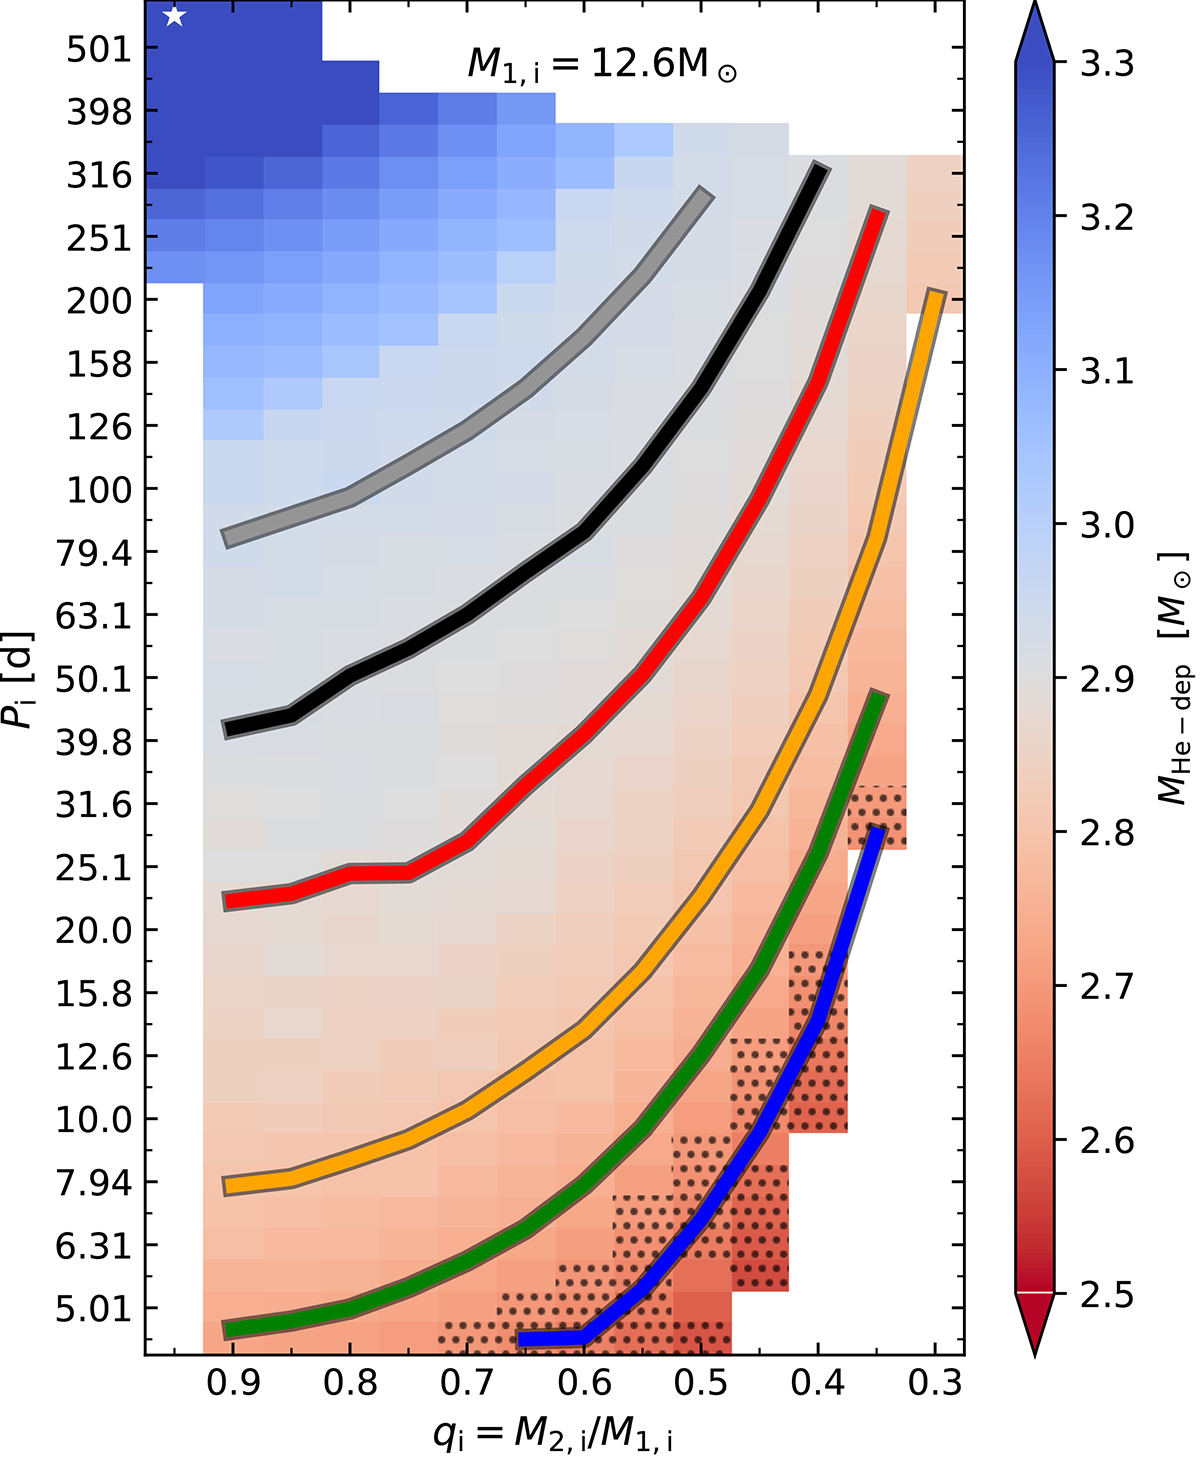
Plot of the log Pi−qi diagram for the binary grid of models from Jin et al. (in prep.), with M1, i = 12.6 M⊙. Each pixel represents one detailed binary evolution model. The color coding represents the mass of the primary star at core helium depletion. The solid lines cover the models where the radius of a single HeS of the same mass (see Fig. 2) matches their Roche lobe radius at core He depletion. White pixels are models that terminated before core-carbon ignition (see Sect. 2.4). The dotted patches correspond to the models which exhibited Case BC RLOF in the binary grid. The star marker in the top-left corner corresponds to the lowest-period model shown in Ercolino et al. (2024).
Current usage metrics show cumulative count of Article Views (full-text article views including HTML views, PDF and ePub downloads, according to the available data) and Abstracts Views on Vision4Press platform.
Data correspond to usage on the plateform after 2015. The current usage metrics is available 48-96 hours after online publication and is updated daily on week days.
Initial download of the metrics may take a while.