Fig. 2.
Download original image
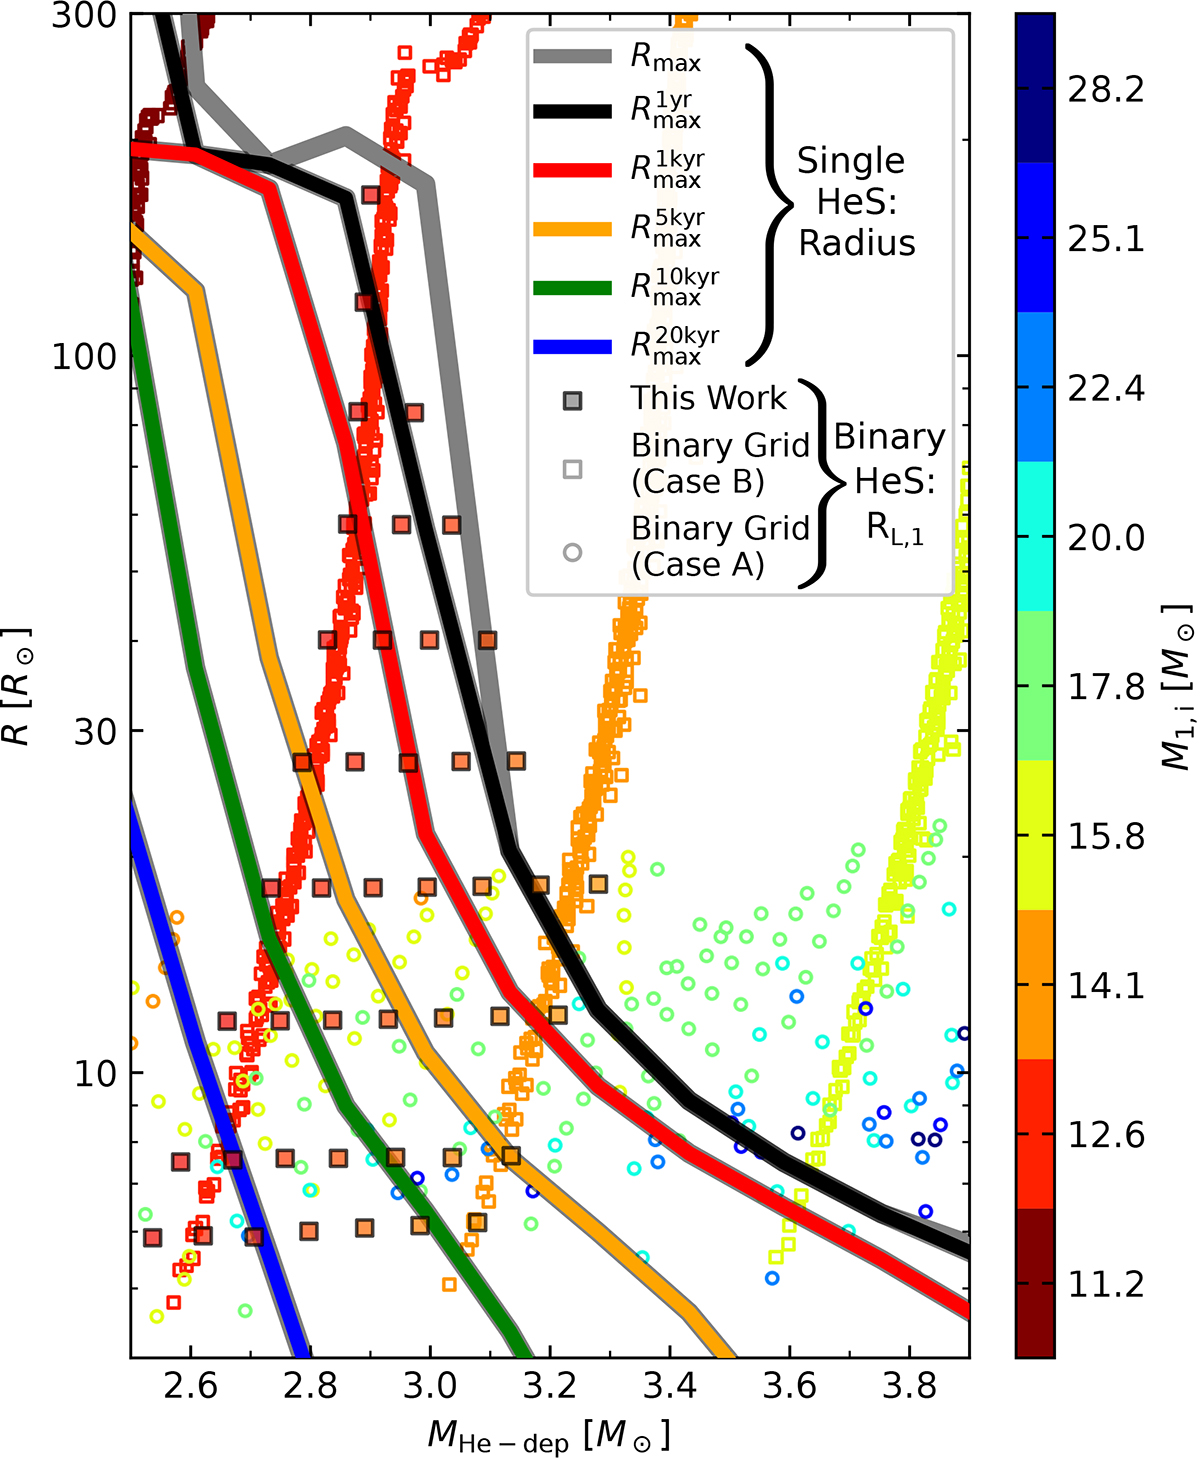
Mass-radius diagram for single HeS models (showing the stellar radius, lines) and binary-stripped HeS models (showing the Roche lobe radius, symbols) as a function of the mass at core He-depletion MHe−dep. For single HeS models, the radius at a time t before the end of the run (![]() ) is plotted for different values of t (see legend). Binary-stripped HeS models are shown for different initial primary masses M1, i (see colorbar), and different markers are used for Case A (circles) and Case B systems (squares). The binary-stripped HeS models are distinguished between those from the binary grid from Jin et al. (in prep., empty markers), and this work (filled markers with black outline).
) is plotted for different values of t (see legend). Binary-stripped HeS models are shown for different initial primary masses M1, i (see colorbar), and different markers are used for Case A (circles) and Case B systems (squares). The binary-stripped HeS models are distinguished between those from the binary grid from Jin et al. (in prep., empty markers), and this work (filled markers with black outline).
Current usage metrics show cumulative count of Article Views (full-text article views including HTML views, PDF and ePub downloads, according to the available data) and Abstracts Views on Vision4Press platform.
Data correspond to usage on the plateform after 2015. The current usage metrics is available 48-96 hours after online publication and is updated daily on week days.
Initial download of the metrics may take a while.