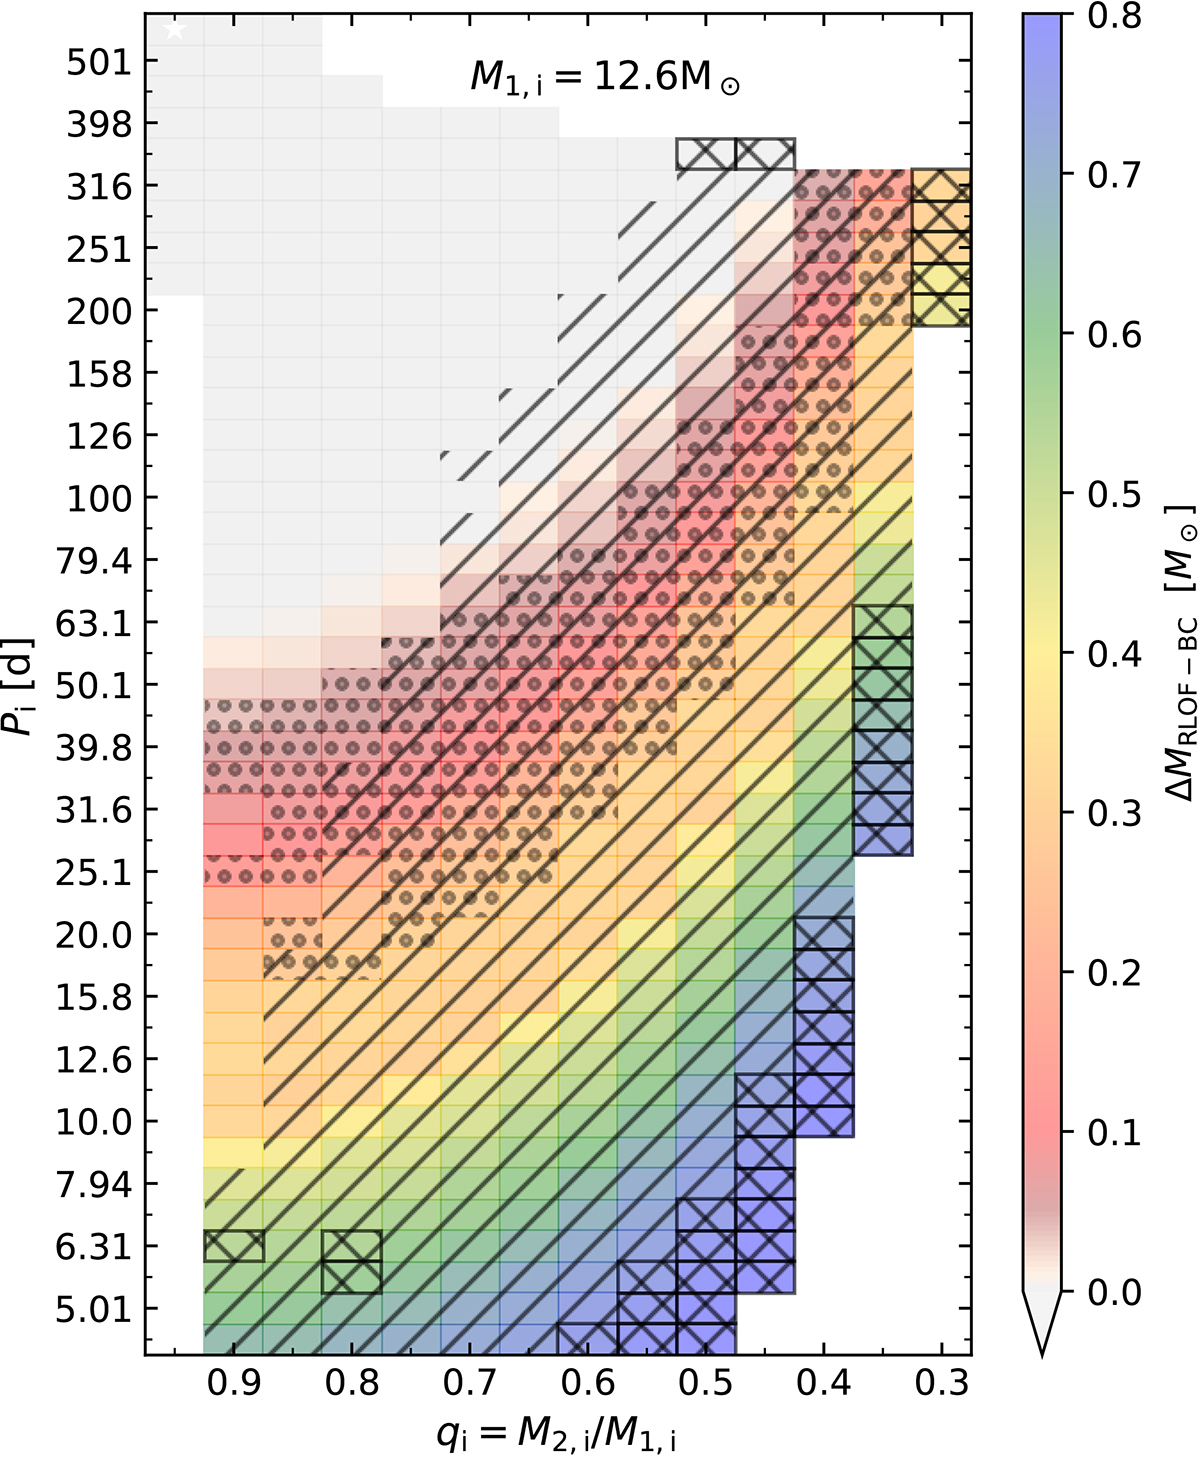
Fig. 16.
Download original image
Plot of the log Pi−qi diagram for the Case B binary models in the binary grid from Jin et al. (in prep.) with M1, i = 12.6 M⊙. The color coding is based on the amount of mass expected to be shed during Case BC RLOF. The hatching indicates models that are flagged as having undergone unstable Case B RLOF according to the criterion from Marchant (2017) (single hatch), Pauli (2020) (cross hatch), and Pavlovskii & Ivanova (2015) (circle hatches).
Current usage metrics show cumulative count of Article Views (full-text article views including HTML views, PDF and ePub downloads, according to the available data) and Abstracts Views on Vision4Press platform.
Data correspond to usage on the plateform after 2015. The current usage metrics is available 48-96 hours after online publication and is updated daily on week days.
Initial download of the metrics may take a while.