Fig. 14.
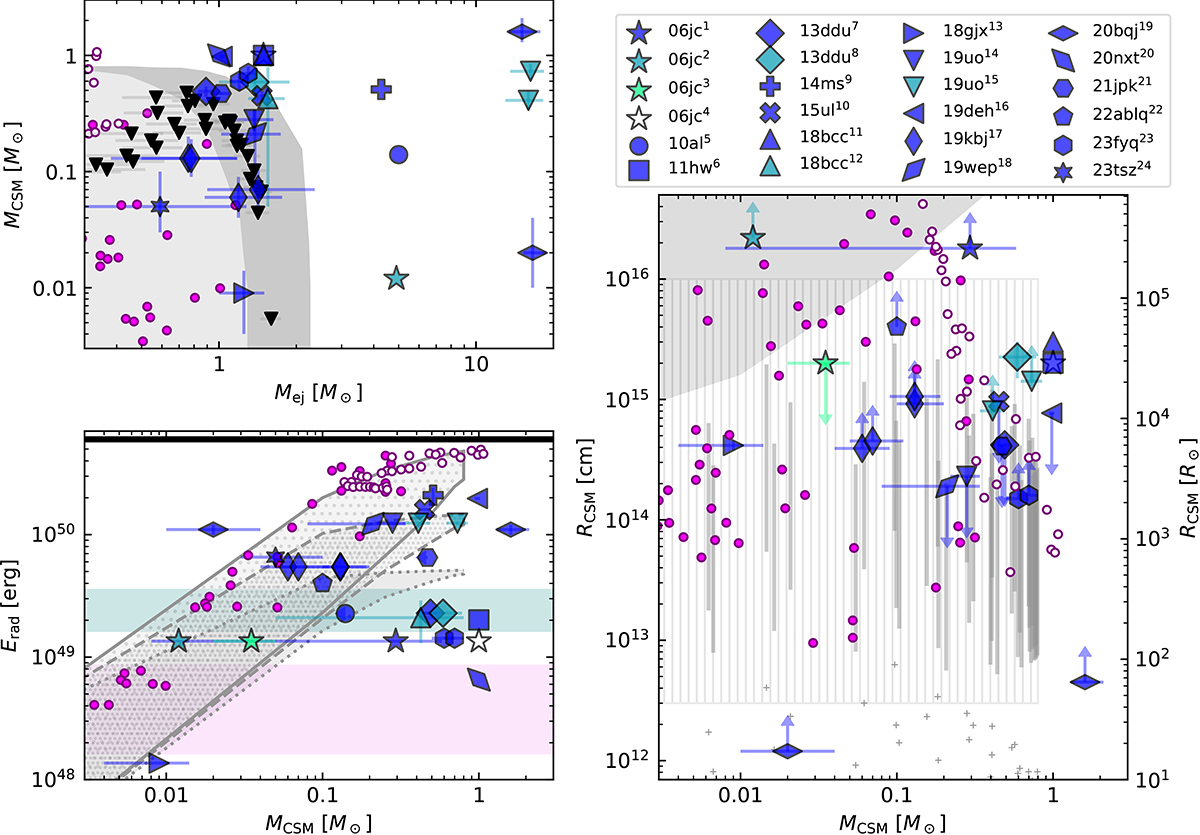
Download original image
Comparison between model data and parameters inferred from observed Type Ibn SNe (blue-scale colored markers). The different markers are associated with different SNe, and different colors for the same SN highlight different references. Estimates inferred from the models of WF22 are also included and are shown as in Fig. 11. Top left: Scatter plot showing the amount of mass of the CSM against the ejecta mass in the models as in Fig. 11. As the values of MCSM from the models is an upper limit, a light-gray region is added where models can still be expected. Right: Scatter plot showing the extent of the CSM against its mass. The position of CBD-like CSM from our models is shown with a gray line for MCSM=ΔMRLOF−BC. The region where CBDs from the models in the binary grid are expected to be found is shown with a vertically hatched region. The radii of our theoretical model are also shown (cross scatter). A gray patch is drawn where to expect the CSM if it were to move constantly at a speed of 10 km s−1. Bottom left: Scatter plot showing the energy released by interaction (Eq. (2)) as a function of CSM mass for the models in this work and WF22 assuming Ekin, ej = 6×1050 erg (shown with a black horizontal line) and the total light-curve energy of the observed SNe. The shaded regions represent the typical Erad of Type Ibc (light-red, Nicholl et al. 2015) and Type Ibn SNe (light-blue, Hosseinzadeh et al. 2017). The values expected from our models and those in the binary grid are summarized in gray regions, which also show the expected Erad if MCSM is lower than the values inferred. Each gray region assumes that the CSM is distributed spherically (solid line, light-hatch), along a CBD with θ = 15° (dashed line, dense hatch) and 5° (dotted line, gray fill) of the orbital plane (see Eq. (4)). References: SN2006jc: (1) Mattila et al. (2008), Pastorello et al. (2007); (2) Tominaga et al. (2008), Pastorello et al. (2007); (3) Chugai (2009), Pastorello et al. (2007); (4) Dessart et al. (2022), Pastorello et al. (2007); SN2010al: (5) Chugai (2022); SN2011hw: (6) Dessart et al. (2022), Pastorello et al. (2015b); LSQ13ddu: (7) Pellegrino et al. (2022a), Clark et al. (2020); (8) Clark et al. (2020), Brethauer et al. (2022); ASASSN-15ms: (9) Vallely et al. (2018); iPTF15ul: (10) Pellegrino et al. (2022a), Hosseinzadeh et al. (2017); SN2018bcc: (11) Dessart et al. (2022), Karamehmetoglu et al. (2021); (12) Karamehmetoglu et al. (2021); SN2018gjx: (13) Prentice et al. (2020); SN2019uo: (14) Pellegrino et al. 2022a; Gangopadhyay et al. 2020; (15) Gangopadhyay et al. (2020); SN2019deh: (16) Pellegrino et al. (2022a); SN2019kbj: (17) Ben-Ami et al. (2023); SN2019wep: (18) Pellegrino et al. (2022a), Gangopadhyay et al. (2022); SN2020bqj: (19) Kool et al. (2021); SN2020nxt: (20) Wang et al. (2024); SN2021jpk: (21) Pellegrino et al. (2022a); SN2022ablq: (22) Pellegrino et al. (2024); SN2023fyq: (23) Dong et al. (2024); SN2023tsz: (24) Warwick et al. (2025).
Current usage metrics show cumulative count of Article Views (full-text article views including HTML views, PDF and ePub downloads, according to the available data) and Abstracts Views on Vision4Press platform.
Data correspond to usage on the plateform after 2015. The current usage metrics is available 48-96 hours after online publication and is updated daily on week days.
Initial download of the metrics may take a while.