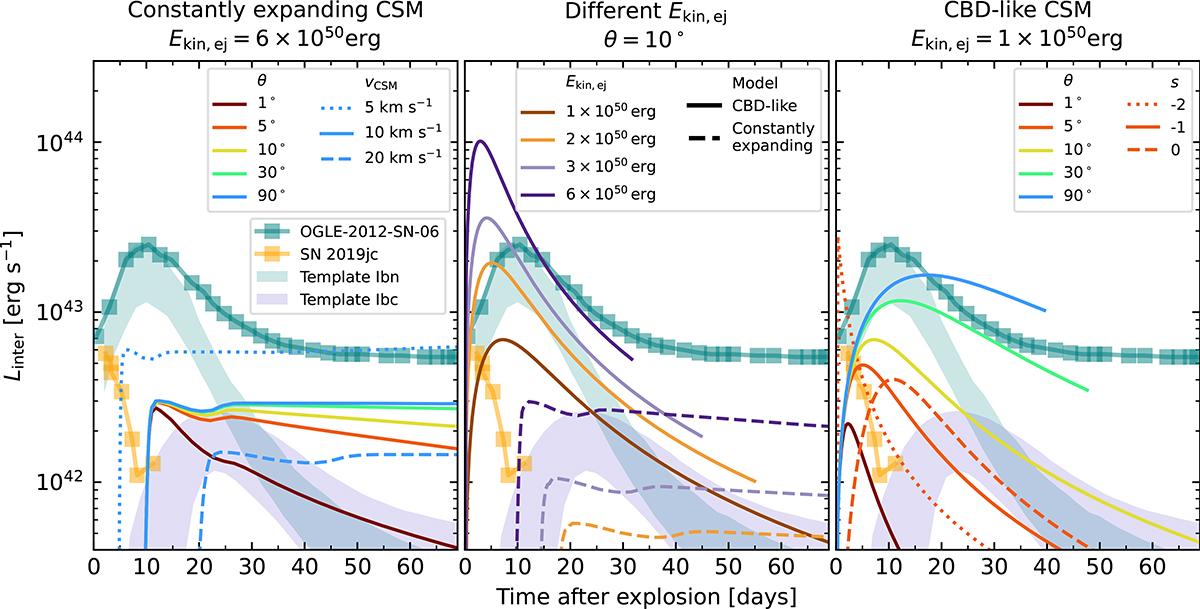
Fig. 13.
Download original image
Interaction-powered light curves for model B12.3p25.1 assuming a constantly expanding CSM (left panel) and a CBD-like CSM (right panel). A comparison of the two approaches with different explosion energies is shown in the center panel. In each panel, two observations are shown, namely, the Type Ibn SN OGLE-2012-SN-006 (Pastorello et al. 2015a, light-blue scatter) and the Type Icn SN 2019jc (Pellegrino et al. 2022b, orange scatter) as well as the template light curves for Type Ibc SNe (Nicholl et al. 2015, in violet, where the peak is located at the same time as in the light curve of model he4 from Dessart et al. 2020) and Type Ibn SNe (Hosseinzadeh et al. 2017, in blue, where the peak is arbitrarily placed at 10 d). Left: The CSM is assumed to constantly be expanding at vCSM = 10 km s−1, with different opening angles (with different colors) and with Ekin, ej = 6×1050 erg. For θ = 90°, models with vCSM of 5 km s−1 (dotted line) and 20 km s−1 (dashed line) are also shown. Center: Interaction power from the CBD-like CSM (solid, with Rin = 1013 cm, Rout = 1015 cm, and s=−1) and a constantly expanding CSM (dashed, with vCSM = 10 km s−1) are shown with different Ekin, ej (different colors), assuming an opening angle θ = 10°. Right: The CSM is assumed to be CBD-like, with Rin = 1013 cm, Rout = 1015 cm, s=−1 and different opening angles (different colors). For θ = 5°, the cases with s = 0 (dashed) and s=−2 (dotted) are also shown.
Current usage metrics show cumulative count of Article Views (full-text article views including HTML views, PDF and ePub downloads, according to the available data) and Abstracts Views on Vision4Press platform.
Data correspond to usage on the plateform after 2015. The current usage metrics is available 48-96 hours after online publication and is updated daily on week days.
Initial download of the metrics may take a while.