Fig. 12.
Download original image
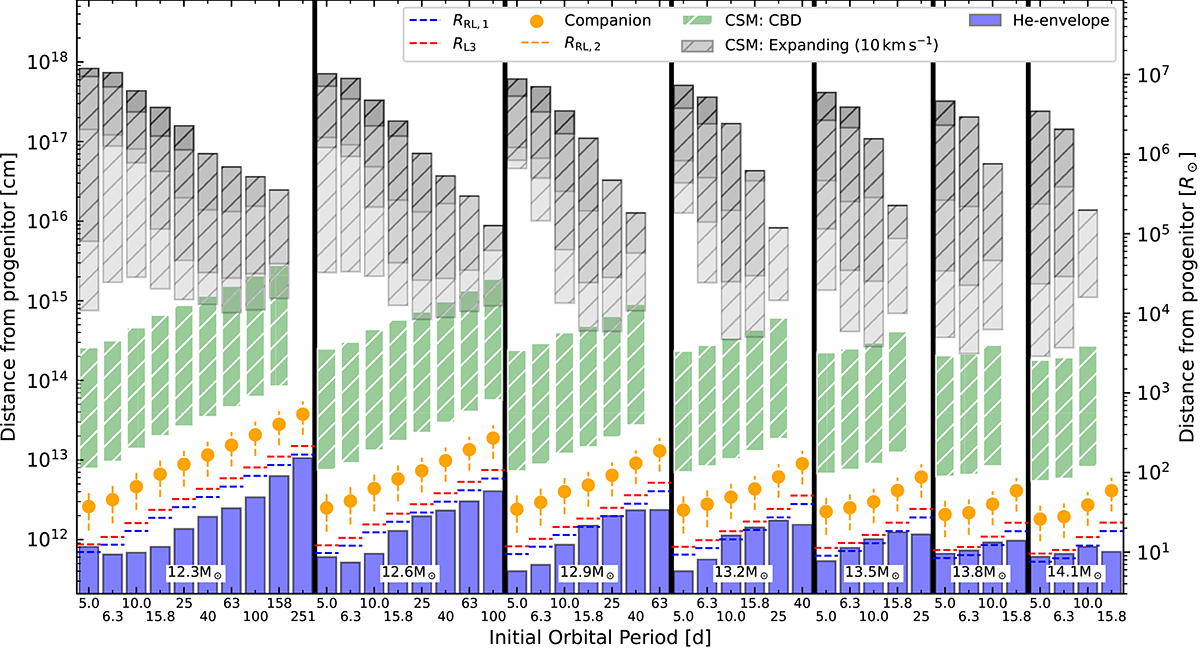
Bar chart of the spatial distribution of material from the SN progenitor models 1 yr prior to the end of the run for the models run in this work. Color bars highlight the envelope (blue filled bar) and the regions where the CSM would be found (hatched bars) if it were distributed along a CBD (green) or if it were expanding isotropically, at a constant speed of 10 km s−1 (gray). In the latter case, the minimum radius is set as the point where the cumulative mass of the CSM from the progenitor star reaches 0.001 M⊙, and increases in contrast when it reaches 0.01, 0.1 and 0.5 M⊙. The Roche lobe radius of the progenitor star is shown (blue hatched-line) as well as the volume-equivalent radius of the outer Lagrangian point (red hatched-line). Finally the companion's location is also shown (orange marker) alongside its Roche lobe (vertical orange hatched-line). The models are grouped by different initial masses (indicated in the bottom of each box).
Current usage metrics show cumulative count of Article Views (full-text article views including HTML views, PDF and ePub downloads, according to the available data) and Abstracts Views on Vision4Press platform.
Data correspond to usage on the plateform after 2015. The current usage metrics is available 48-96 hours after online publication and is updated daily on week days.
Initial download of the metrics may take a while.