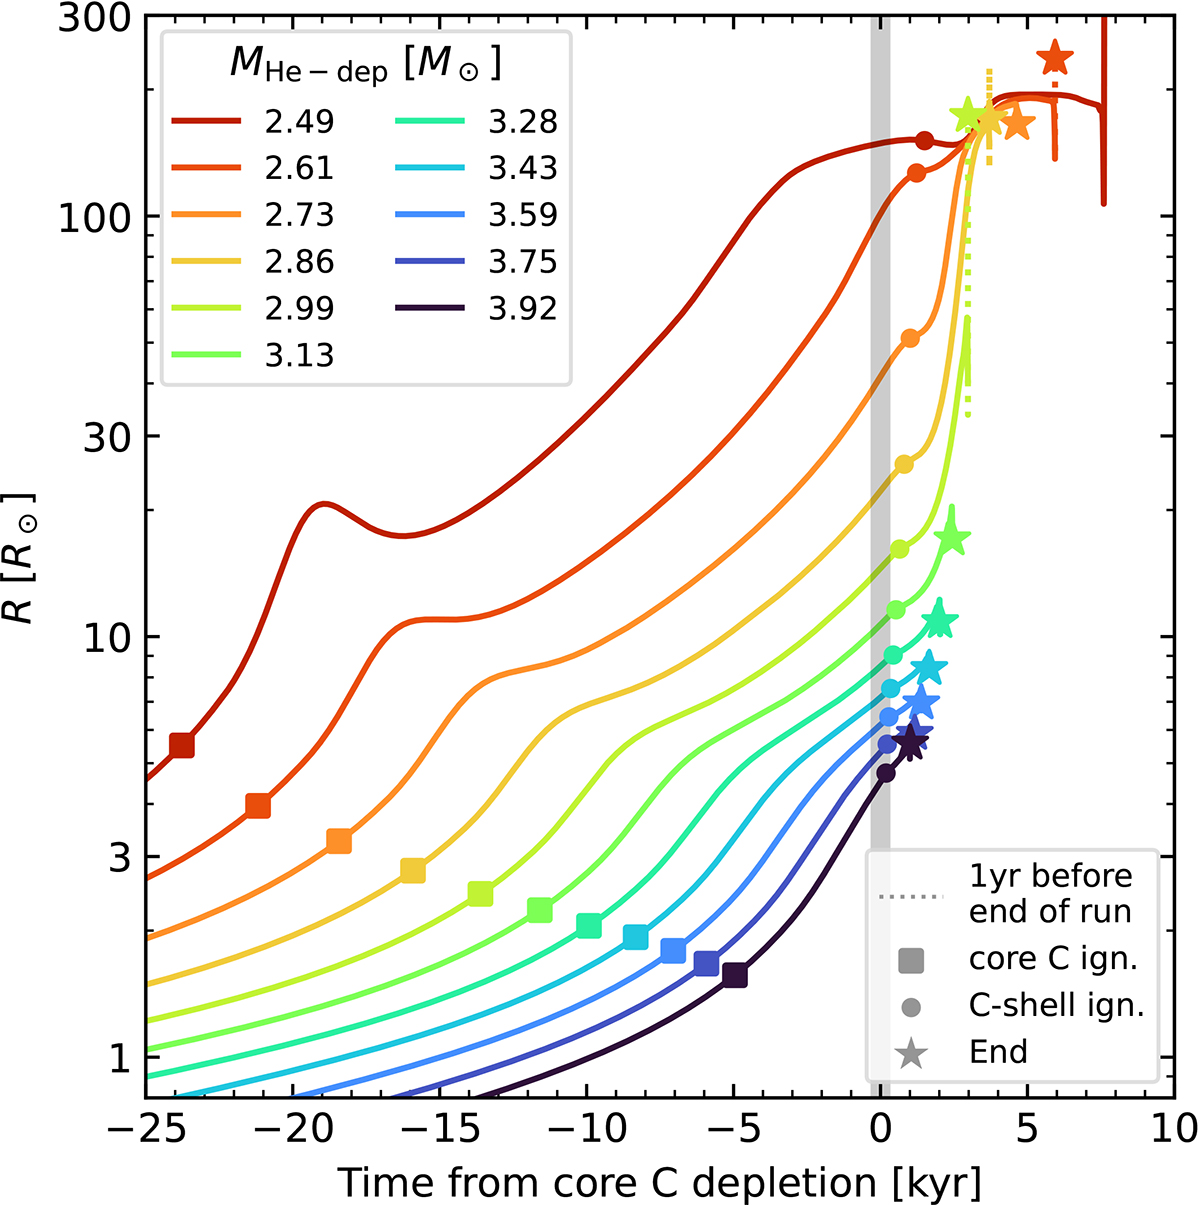
Fig. 1.
Download original image
Evolution of the radius of single HeS models as a function of time during and after core carbon burning, with t = 0 set at core carbon depletion. The square markers indicate core carbon ignition, circles indicate the time when the first carbon shell develops, and stars mark the end of the calculation. For the lowest mass model, no endpoint is shown (see Sect. 3.1).
Current usage metrics show cumulative count of Article Views (full-text article views including HTML views, PDF and ePub downloads, according to the available data) and Abstracts Views on Vision4Press platform.
Data correspond to usage on the plateform after 2015. The current usage metrics is available 48-96 hours after online publication and is updated daily on week days.
Initial download of the metrics may take a while.