Fig. 8.
Download original image
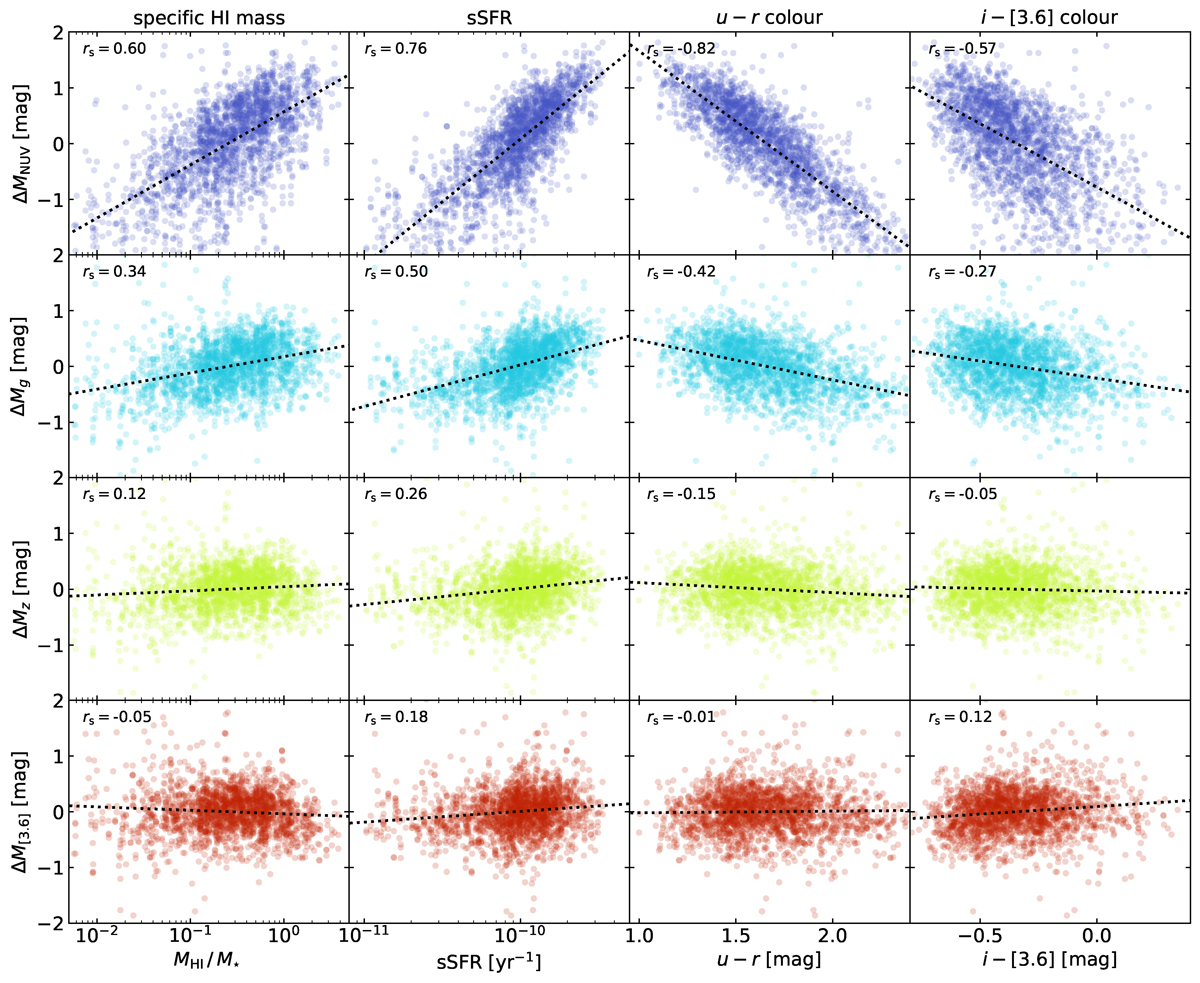
Correlations between ΔM and intensive galaxy properties. Each panel shows a scatter plot of the residual between the actual absolute magnitude and the magnitude expected from the TFR, and an intensive galaxy property (from left to right: specific H I mass, sSFR, u − r colour, and i − [3.6] colour). The different rows correspond to different broadband filters (from top to bottom: NUV, g, z, and [3.6]). In each panel, the dotted line is the best-fitting linear fit to the data, and the Spearman rank correlation coefficient is indicated in the top right corner.
Current usage metrics show cumulative count of Article Views (full-text article views including HTML views, PDF and ePub downloads, according to the available data) and Abstracts Views on Vision4Press platform.
Data correspond to usage on the plateform after 2015. The current usage metrics is available 48-96 hours after online publication and is updated daily on week days.
Initial download of the metrics may take a while.