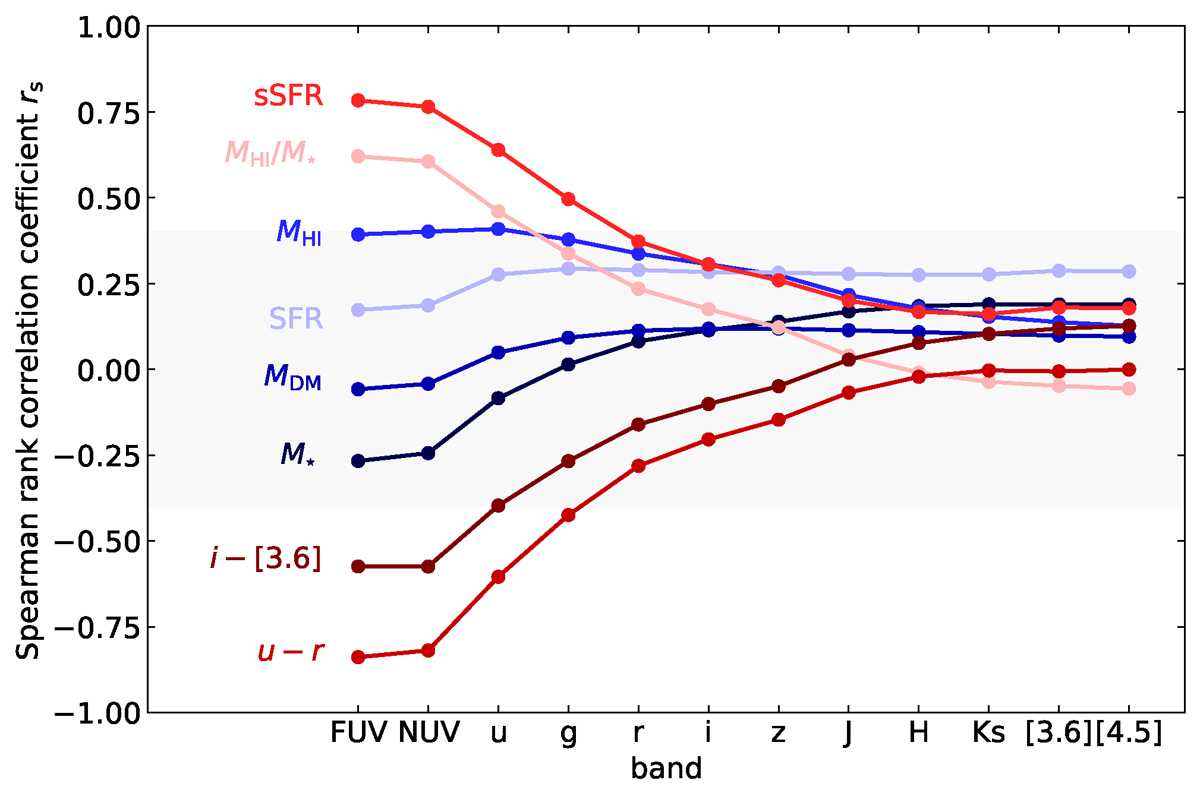
Fig. 7.

Download original image
Search for a second parameter in the TFR. The plot shows the Spearman rank correlation coefficients for the correlations between ΔM, the residual between the actual absolute magnitude and the magnitude expected from the TFR, and eight different galaxy properties, as a function of the broadband. Extensive galaxy properties are shown in blue hues, intensive properties in red hues. The grey band corresponds to |rs|< 0.4, usually considered as the region of negligible to weak correlations.
Current usage metrics show cumulative count of Article Views (full-text article views including HTML views, PDF and ePub downloads, according to the available data) and Abstracts Views on Vision4Press platform.
Data correspond to usage on the plateform after 2015. The current usage metrics is available 48-96 hours after online publication and is updated daily on week days.
Initial download of the metrics may take a while.


