Open Access
Fig. 5.
Download original image
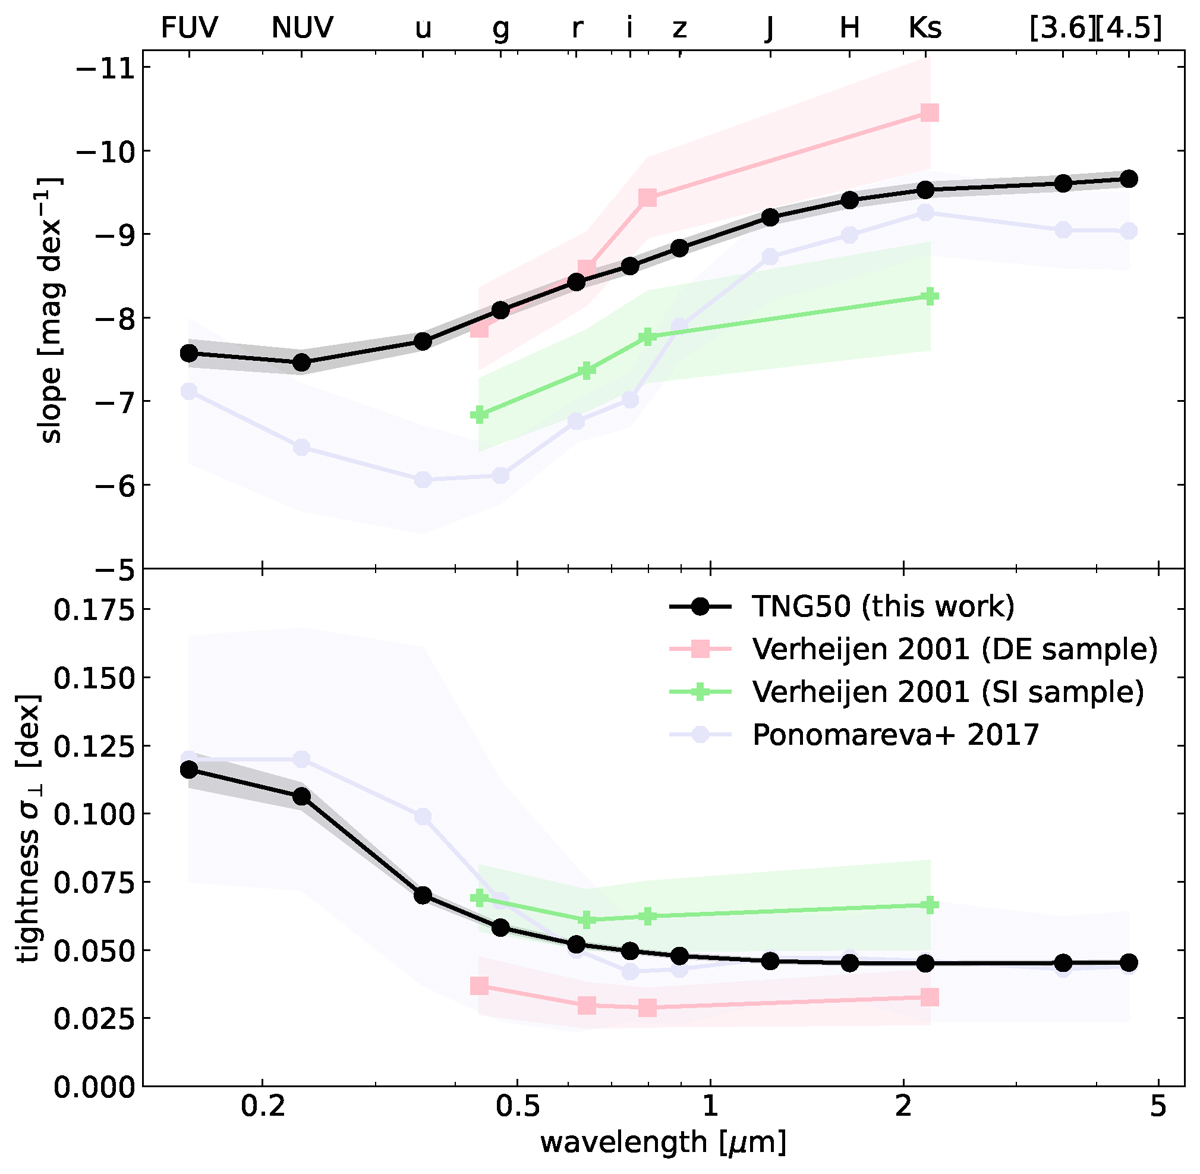
Slope (top panel) and tightness (bottom) panel of the TFR as a function of wavelength. Black dots are our TNG50 TFR results, the coloured lines are the results from the observational samples of V01 and P17. All results in this figure are based on the same fitting method. Shaded regions indicate 1-σ uncertainty intervals.
Current usage metrics show cumulative count of Article Views (full-text article views including HTML views, PDF and ePub downloads, according to the available data) and Abstracts Views on Vision4Press platform.
Data correspond to usage on the plateform after 2015. The current usage metrics is available 48-96 hours after online publication and is updated daily on week days.
Initial download of the metrics may take a while.