Open Access
Fig. 4.
Download original image
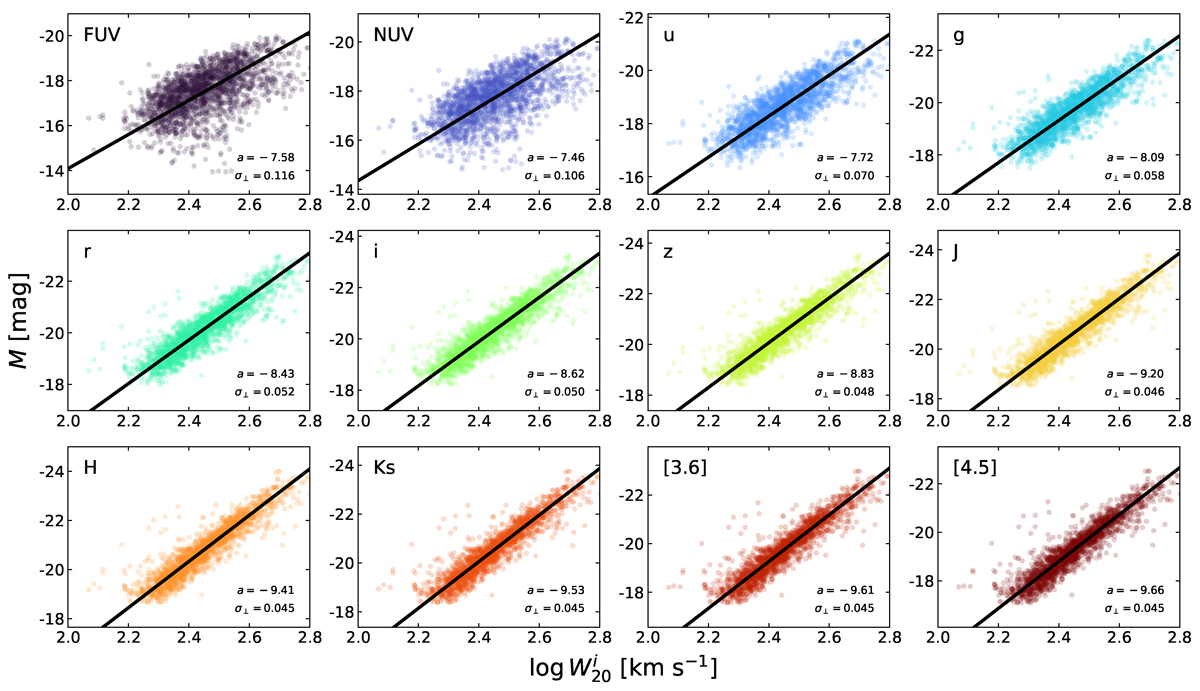
Multi-wavelength TFR for the simulated disc galaxies in our TNG50 sample. The different panels correspond to different broadband filters in order of increasing wavelength. The slope and the tightness of the TFR are indicated in the bottom right corner of each panel.
Current usage metrics show cumulative count of Article Views (full-text article views including HTML views, PDF and ePub downloads, according to the available data) and Abstracts Views on Vision4Press platform.
Data correspond to usage on the plateform after 2015. The current usage metrics is available 48-96 hours after online publication and is updated daily on week days.
Initial download of the metrics may take a while.