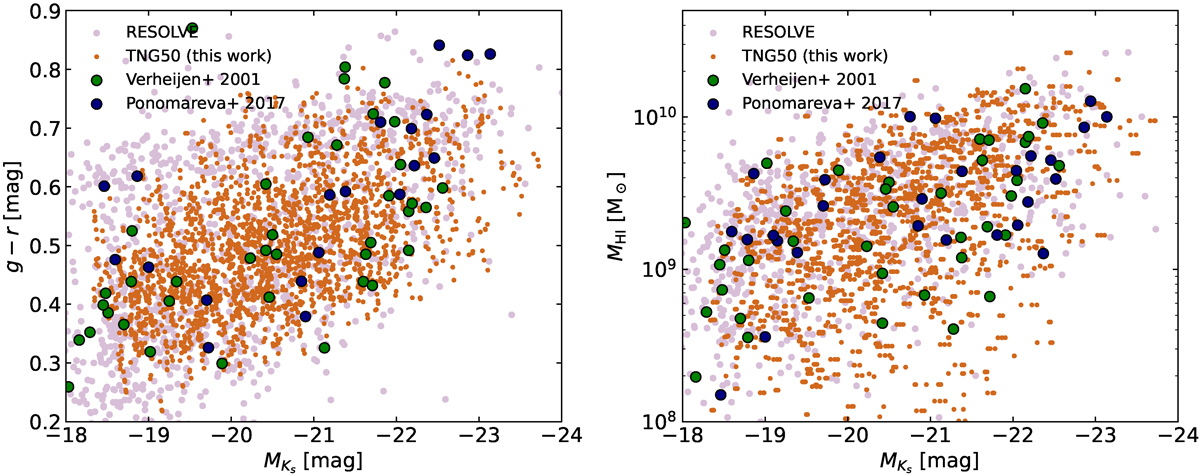
Fig. 2.
Download original image
Scatter plots comparing the location of our TNG50 simulated galaxy sample, the V01 and P17 galaxy samples, and the volume-limited RESOLVE galaxy sample. The left and right panel show the g − r colour and the H I mass as a function of Ks-band absolute magnitude, respectively. Colours and absolute magnitudes for the simulated TNG50 galaxies are determined as described in Sect. 3.1. For the V01 sample, g − r colours are calculated from the B − R colours using the conversion formula of Fukugita et al. (2011).
Current usage metrics show cumulative count of Article Views (full-text article views including HTML views, PDF and ePub downloads, according to the available data) and Abstracts Views on Vision4Press platform.
Data correspond to usage on the plateform after 2015. The current usage metrics is available 48-96 hours after online publication and is updated daily on week days.
Initial download of the metrics may take a while.