Fig. 1.
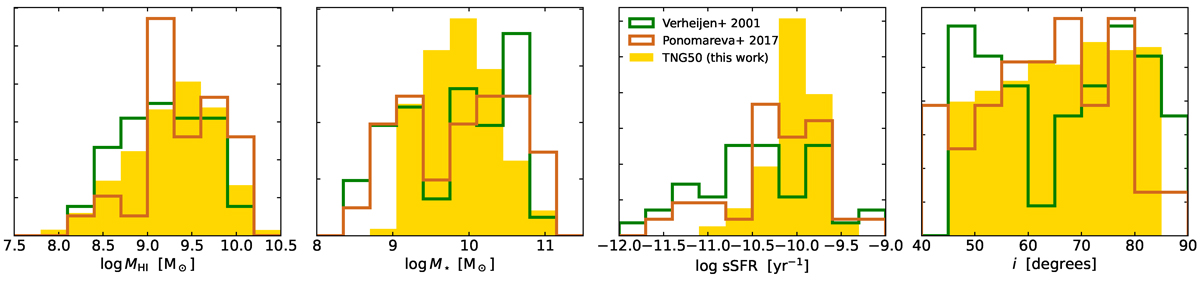
Download original image
Histograms of basic properties of our TNG50 and the V01 and P17 galaxy samples. From left to right: H I mass, stellar mass, specific star formation rate, and inclination. For the simulated TNG50 galaxies, H I masses and inclinations are determined as discussed in Sect. 3.2, while stellar masses and SFRs are obtained directly from the simulation particle data (Nelson et al. 2019a). For the V01 sample, H I masses and inclinations are obtained from Verheijen & Sancisi (2001). Stellar masses are calculated using the relation between K-band mass-to-light ratio and B − R colour by Bell & de Jong (2001), with B, R and K absolute magnitudes taken from Tully et al. (1996). SFRs for the V01 sample galaxies are estimated from integrated GALEX FUV-band luminosities using Eq. (3) of Lee et al. (2009), based on fluxes collected from different sources, primarily Hao et al. (2011) and Bouquin et al. (2018). For the P17 sample, H I masses and inclinations are directly taken from P17. For the galaxies of this sample, stellar masses and SFRs have been determined by Ponomareva et al. (2018) using SED fits with the MAGPHYS code (da Cunha et al. 2008).
Current usage metrics show cumulative count of Article Views (full-text article views including HTML views, PDF and ePub downloads, according to the available data) and Abstracts Views on Vision4Press platform.
Data correspond to usage on the plateform after 2015. The current usage metrics is available 48-96 hours after online publication and is updated daily on week days.
Initial download of the metrics may take a while.