Open Access
Fig. 7
Download original image
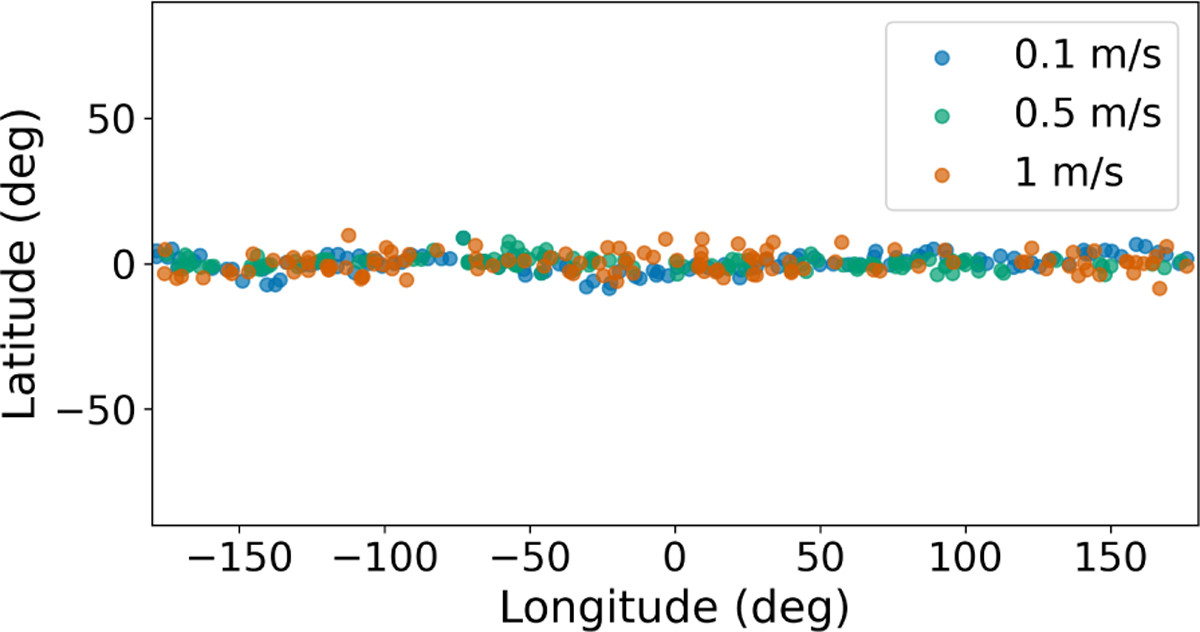
Final positions of the launched particles after they return to the surface. The different colors denote the different initial velocities of the particles. Particles that did not return to the surface by the end of the simulation are not shown.
Current usage metrics show cumulative count of Article Views (full-text article views including HTML views, PDF and ePub downloads, according to the available data) and Abstracts Views on Vision4Press platform.
Data correspond to usage on the plateform after 2015. The current usage metrics is available 48-96 hours after online publication and is updated daily on week days.
Initial download of the metrics may take a while.