Fig. 3
Download original image
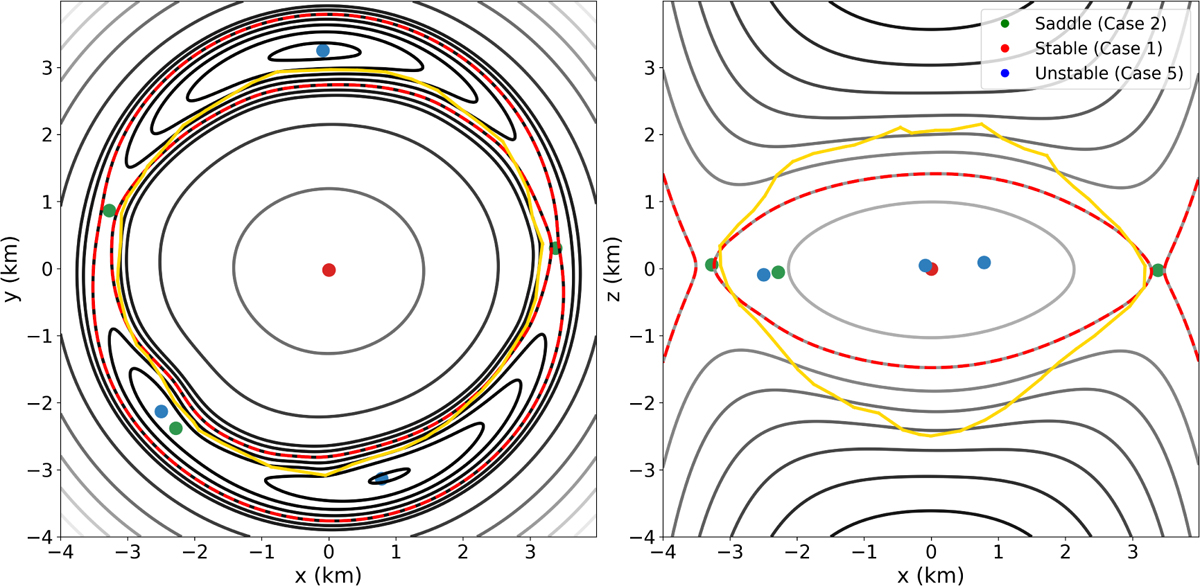
Equilibrium and zero-velocity curves (ZVCs) around Phaethon. Phaethon’s outline is shown with the yellow lines. The ZVCs are represented by gray lines, with larger V values shown with darker hues. The ZVC interval for the left panel was adjusted to enhance the geopotential around the EPs The dotted red lines are the ZVCs of the minimum geopotential outside of Phaethon, also known as the “rotational Roche lobe” (Scheeres 2012).
Current usage metrics show cumulative count of Article Views (full-text article views including HTML views, PDF and ePub downloads, according to the available data) and Abstracts Views on Vision4Press platform.
Data correspond to usage on the plateform after 2015. The current usage metrics is available 48-96 hours after online publication and is updated daily on week days.
Initial download of the metrics may take a while.