Fig. 4.
Download original image
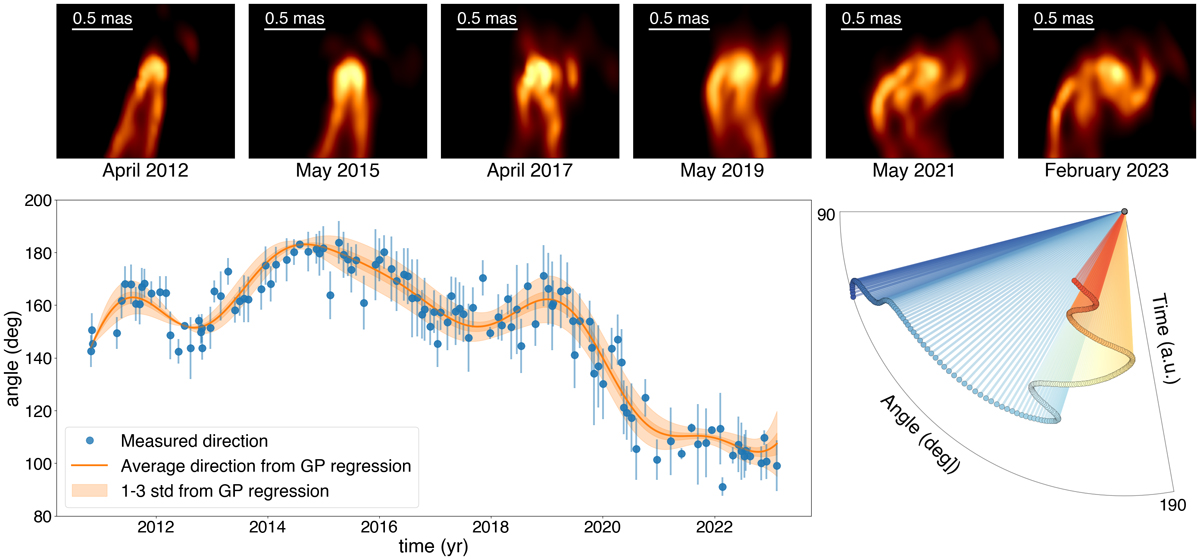
Top: Details of the core region in 3C 84 for six selected epochs. Bottom left: Angle of the jet launching direction as a function of time. The angle is measured east of north. The measured direction from each epoch is shown in blue and the average of a GP regression to the data in orange. The orange shading indicates the 1 sigma (dark shade) and 3 sigma (light shade) uncertainty from the GP regression. Bottom right: Average direction from the GP regression, plotted in angular coordinates for a more intuitive representation of the direction change. Red corresponds to earlier epochs and blue to later epochs.
Current usage metrics show cumulative count of Article Views (full-text article views including HTML views, PDF and ePub downloads, according to the available data) and Abstracts Views on Vision4Press platform.
Data correspond to usage on the plateform after 2015. The current usage metrics is available 48-96 hours after online publication and is updated daily on week days.
Initial download of the metrics may take a while.