Fig. 8.
Download original image
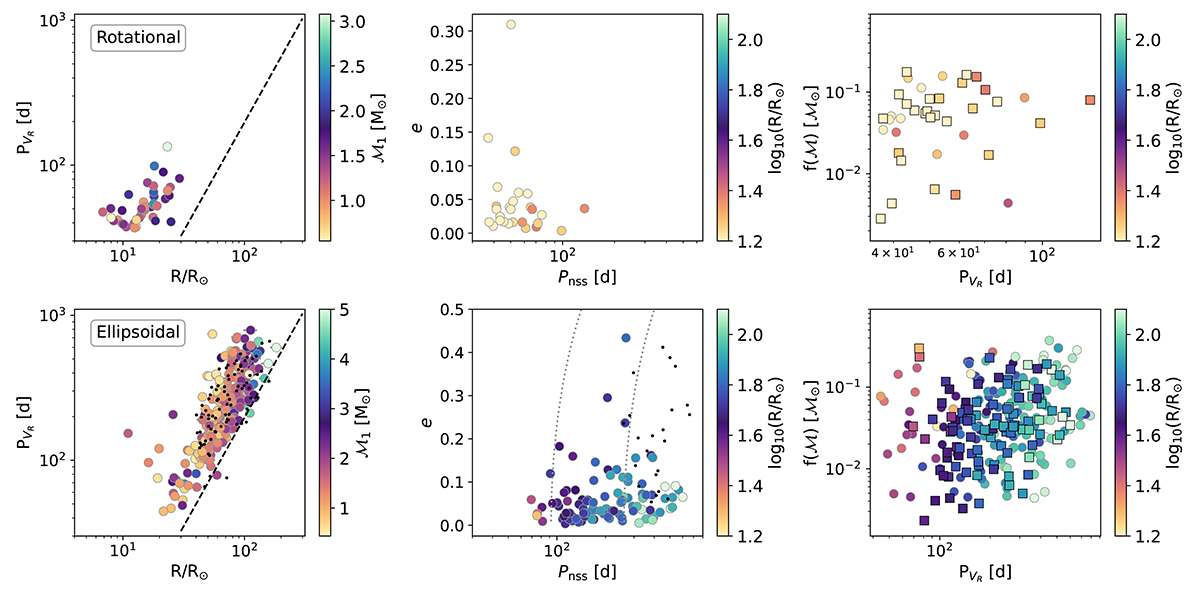
Period versus radius (left), eccentricity (middle), and mass-function (left) for rotational variables (top panels), and ellipsoidal variable candidates (bottom panels). Left panels: Stellar radius of the primary star versus the orbital period. The color coding is based on the mass of the primary star. The dashed line corresponds to the threshold period while the black dots are ellipsoidal binaries in the LMC (Nie et al. 2017). Middle panels: Orbital period versus the eccentricity for sources with an NSS orbital solution of “SB1.” The color coding is according to the primary radius. For ellipsoidal variables, the circularization threshold for two values of radius is shown as dotted grey lines and black dots are ellipsoidal binaries in the LMC. Right panels: Orbital period versus mass function f(ℳ). The color coding is according to the primary radius. Sources with eccentricity estimates are shown as squares, while those without eccentricity measurements are shown as circles.
Current usage metrics show cumulative count of Article Views (full-text article views including HTML views, PDF and ePub downloads, according to the available data) and Abstracts Views on Vision4Press platform.
Data correspond to usage on the plateform after 2015. The current usage metrics is available 48-96 hours after online publication and is updated daily on week days.
Initial download of the metrics may take a while.