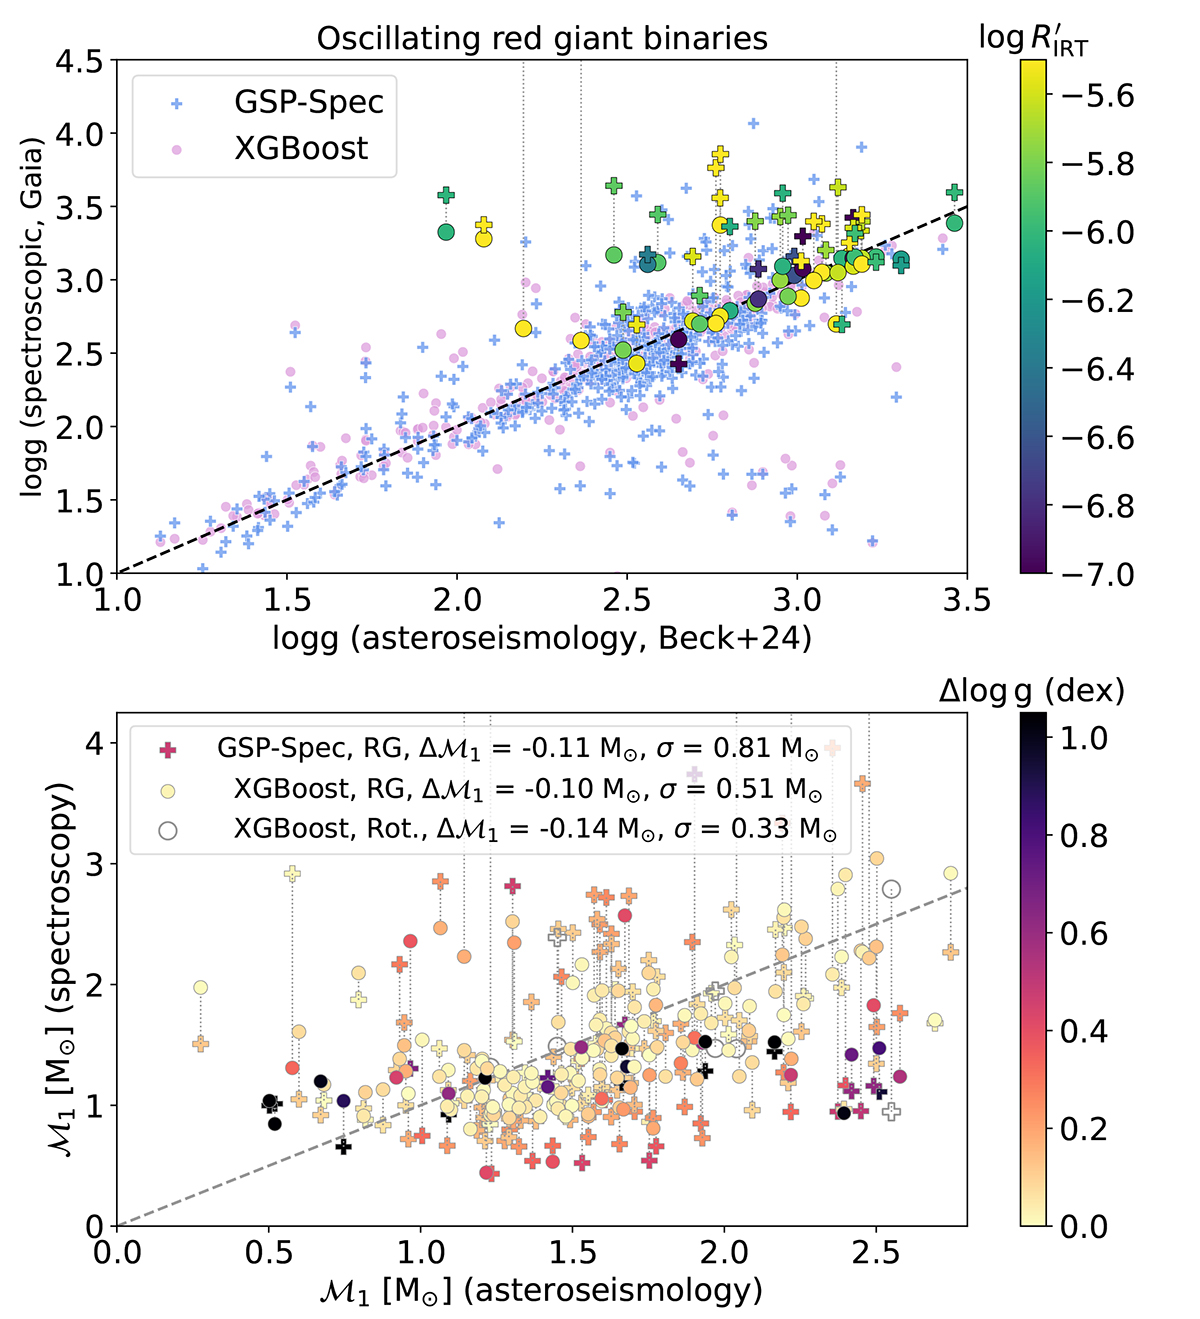
Fig. 7.
Download original image
Spectroscopic GSP-Spec (crosses) and XGBoost (circles) parameters and asteroseismic measurements of the surface gravity (top panel) and masses (bottom panel) of red giant binaries (Beck et al. 2024) and rotational binaries (Gaulme et al. 2020) with solar-like oscillations. The two spectroscopic values are connected with a vertical dashed line. The color bar shows the activity index and the difference in Δlog g in the top and bottom panels, respectively. The median difference and dispersion between spectroscopic and asteroseismic masses are quoted in the bottom panel.
Current usage metrics show cumulative count of Article Views (full-text article views including HTML views, PDF and ePub downloads, according to the available data) and Abstracts Views on Vision4Press platform.
Data correspond to usage on the plateform after 2015. The current usage metrics is available 48-96 hours after online publication and is updated daily on week days.
Initial download of the metrics may take a while.