Fig. 6.
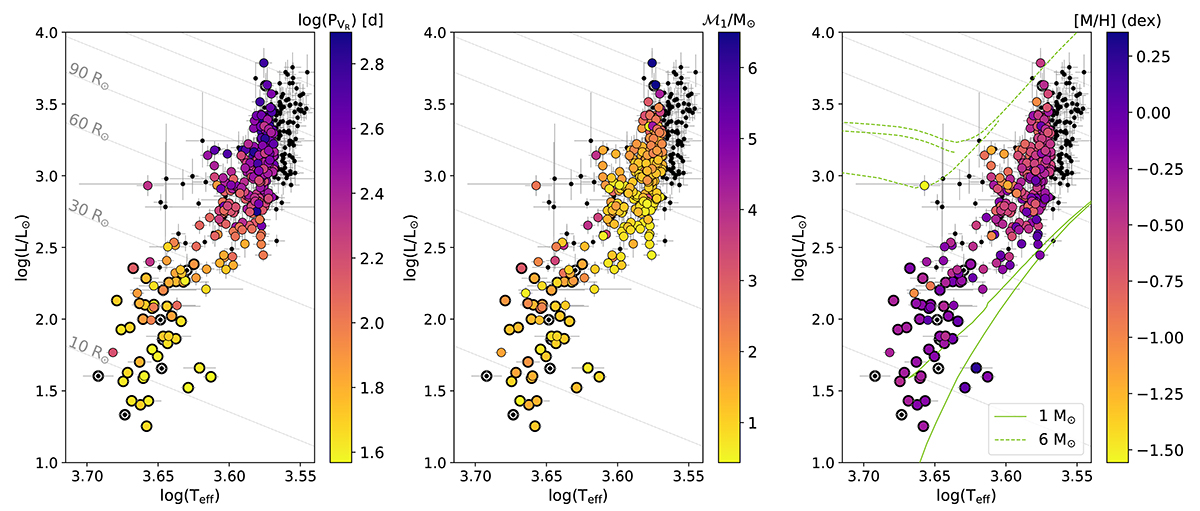
Download original image
Hertzsprung-Russell diagram for the sample of rotational and ellipsoidal binaries. From left to right, the points are color coded according to the logarithm of its orbital period, PVR, the mass of the primary star, and the adopted spectroscopic metallicity [M/H]. Black points correspond to stars with unreliable extinction determination (mostly stars with Teff ≤ 3700 K; see Sect. 3.1) and therefore potentially unreliable stellar parameters, while those with a thick black edge are the rotational candidates. The grey lines correspond to constant radii of 10, 30, 60, 90, 120, 150, and 180 R⊙. In the right panel, the evolutionary tracks for a 1 M⊙ (green curve) and a 6 M⊙ (green dashed curve) star, having Z = 0.004 ([M/H]∼ − 0.6), from the grid computed by Lagarde et al. (2012), based on the STAREVOL (Siess et al. 2000) code, are included.
Current usage metrics show cumulative count of Article Views (full-text article views including HTML views, PDF and ePub downloads, according to the available data) and Abstracts Views on Vision4Press platform.
Data correspond to usage on the plateform after 2015. The current usage metrics is available 48-96 hours after online publication and is updated daily on week days.
Initial download of the metrics may take a while.