Open Access
Fig. C.1.
Download original image
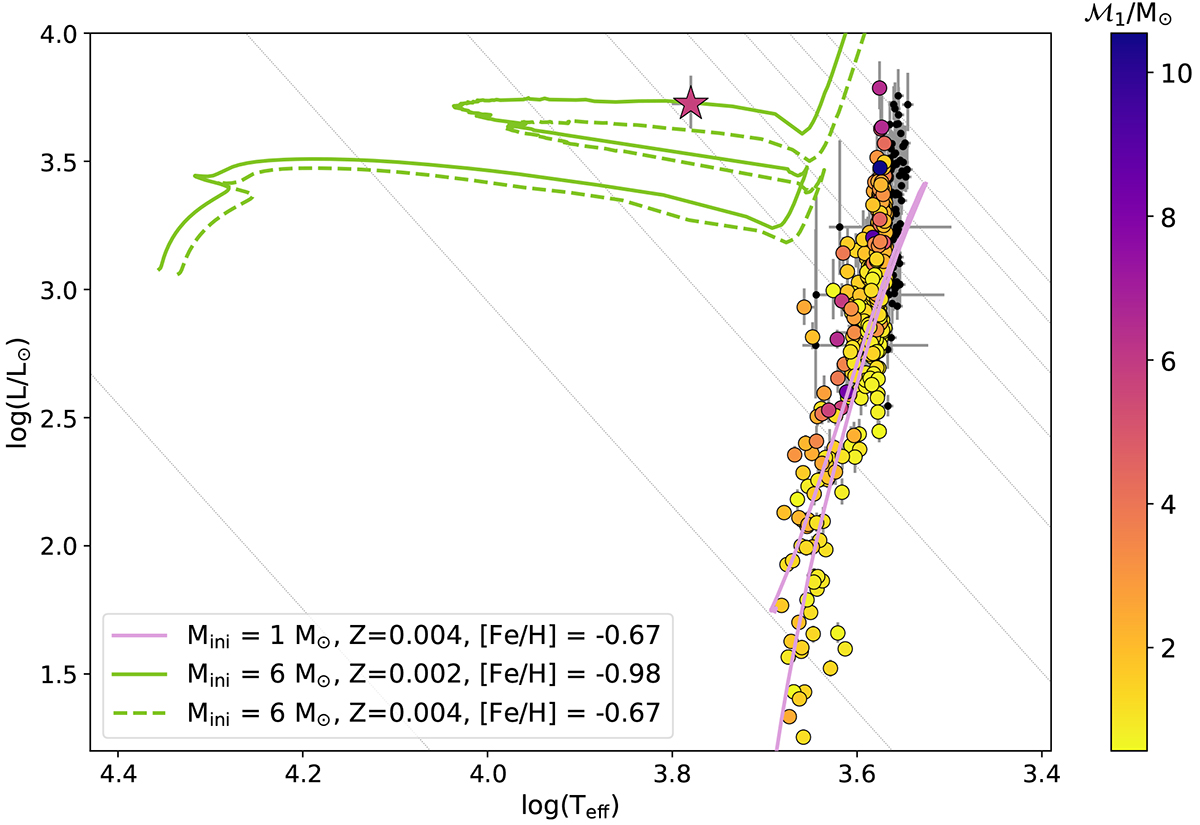
HR diagram for Gaia DR3 517611939345861120 (star symbol) along with the rest of the sample of red giant binaries, color coded by their spectroscopic mass. The grey lines correspond to radii of 1, 10, 30, 60, 90, 120, 150, 180 R⊙. Different evolutionary tracks from STAREVOL (Siess et al. 2000) have been included.
Current usage metrics show cumulative count of Article Views (full-text article views including HTML views, PDF and ePub downloads, according to the available data) and Abstracts Views on Vision4Press platform.
Data correspond to usage on the plateform after 2015. The current usage metrics is available 48-96 hours after online publication and is updated daily on week days.
Initial download of the metrics may take a while.