Open Access
Fig. 2.
Download original image
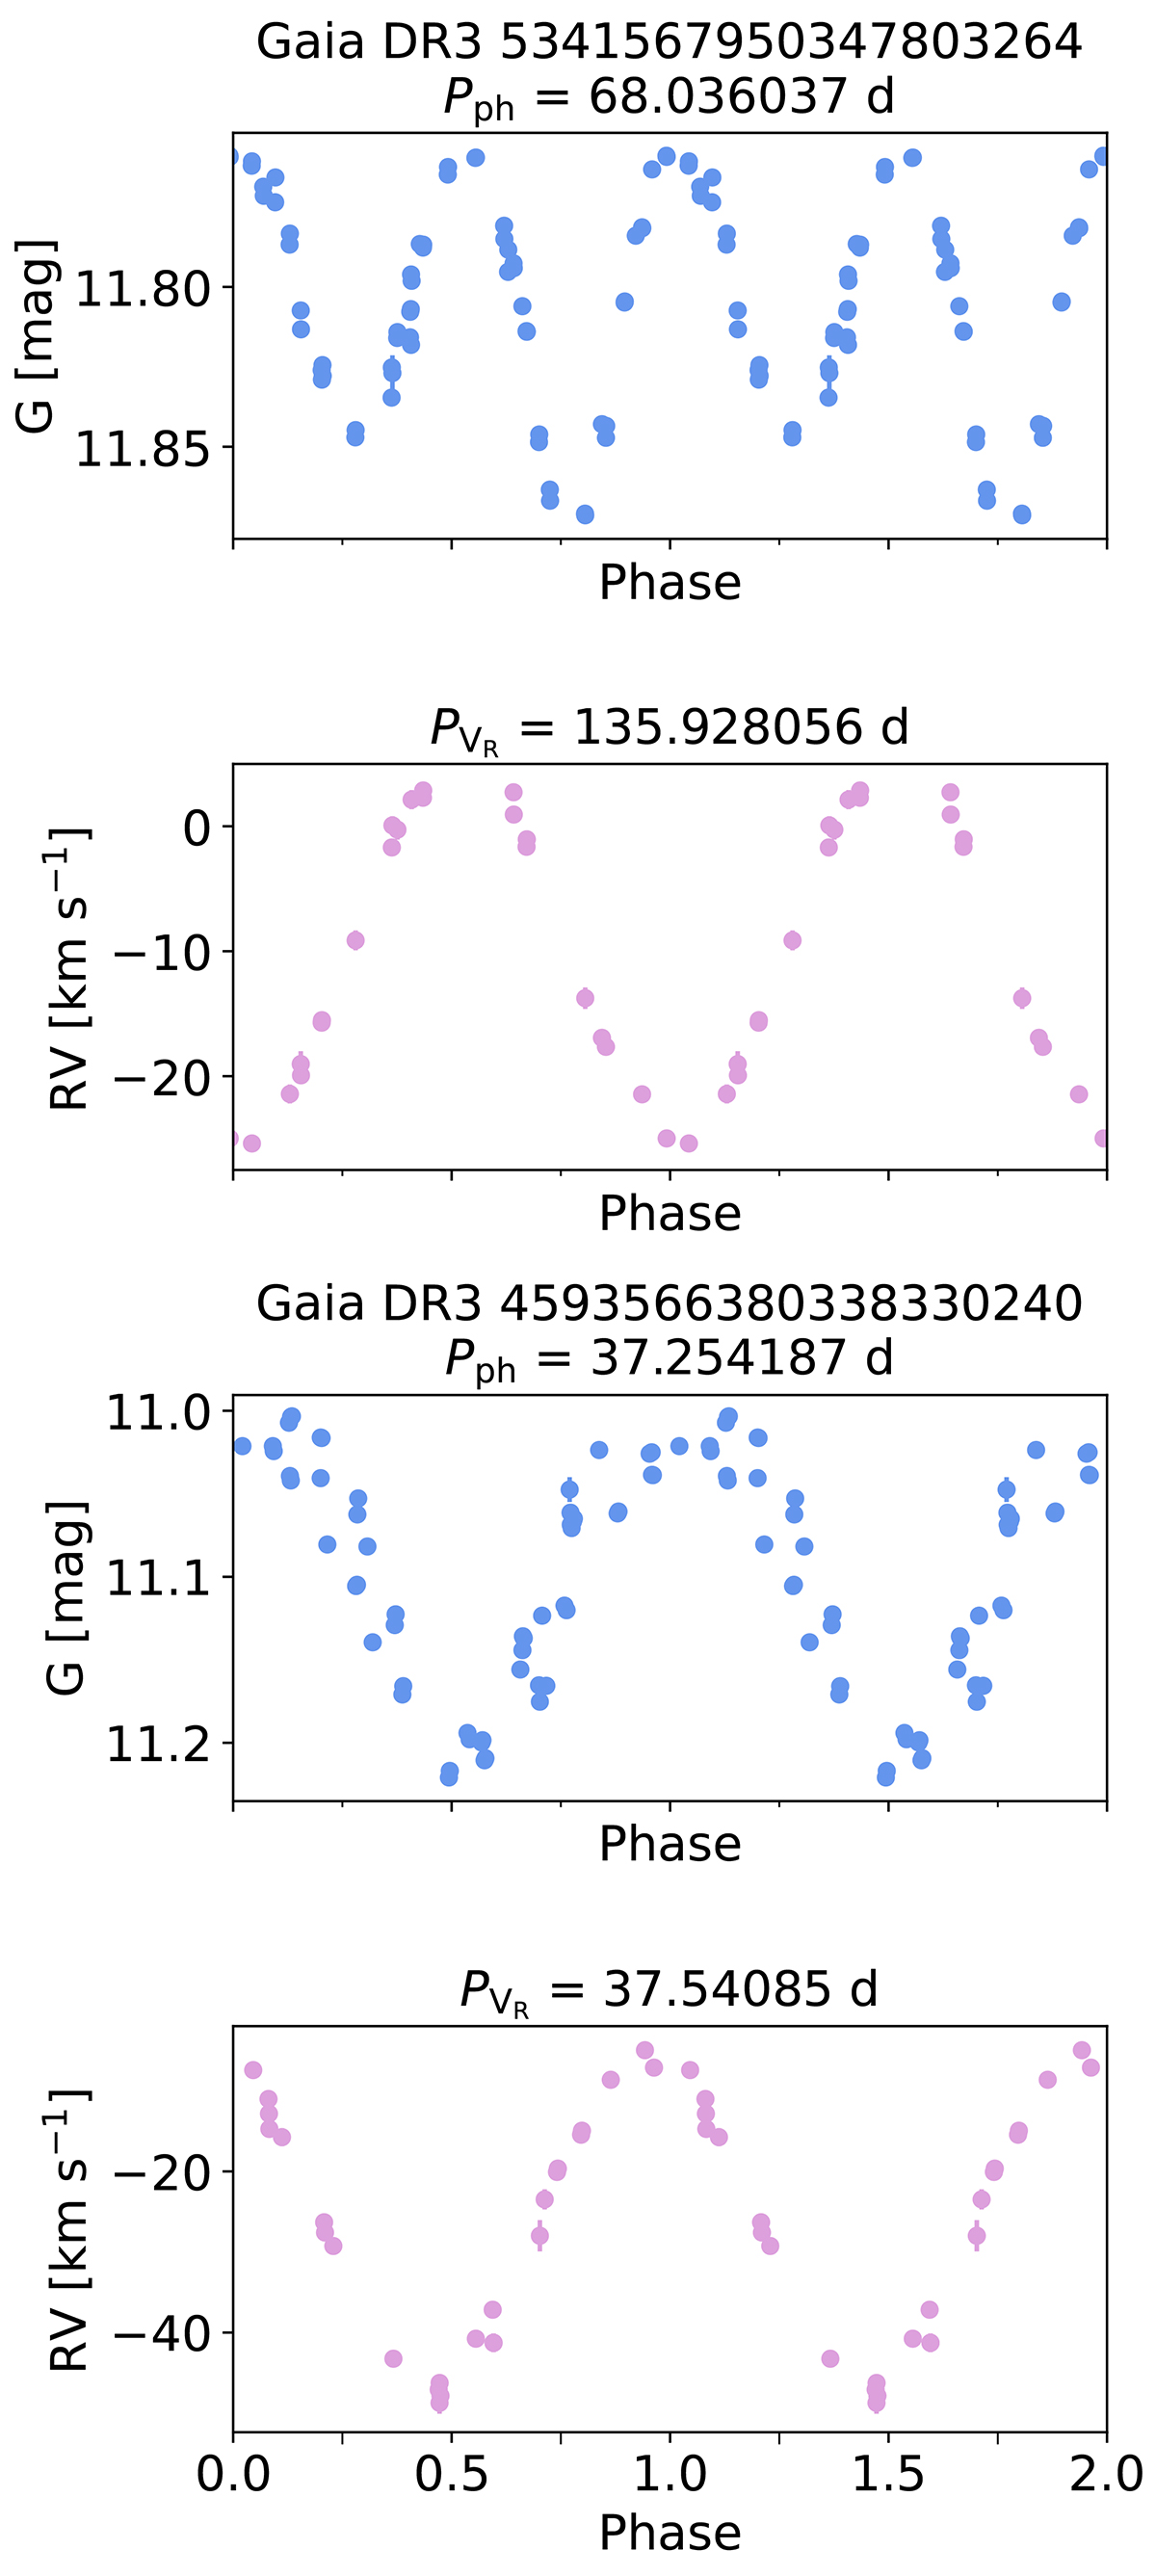
G-band and RV curves for one ellipsoidal binary candidate (the two top panels) and one rotational candidate (the two bottom panels). The G-band light curve was phase-folded using the period from the RV curve in the case of the ellipsoidal variable, recovering the two minima per orbital cycle.
Current usage metrics show cumulative count of Article Views (full-text article views including HTML views, PDF and ePub downloads, according to the available data) and Abstracts Views on Vision4Press platform.
Data correspond to usage on the plateform after 2015. The current usage metrics is available 48-96 hours after online publication and is updated daily on week days.
Initial download of the metrics may take a while.