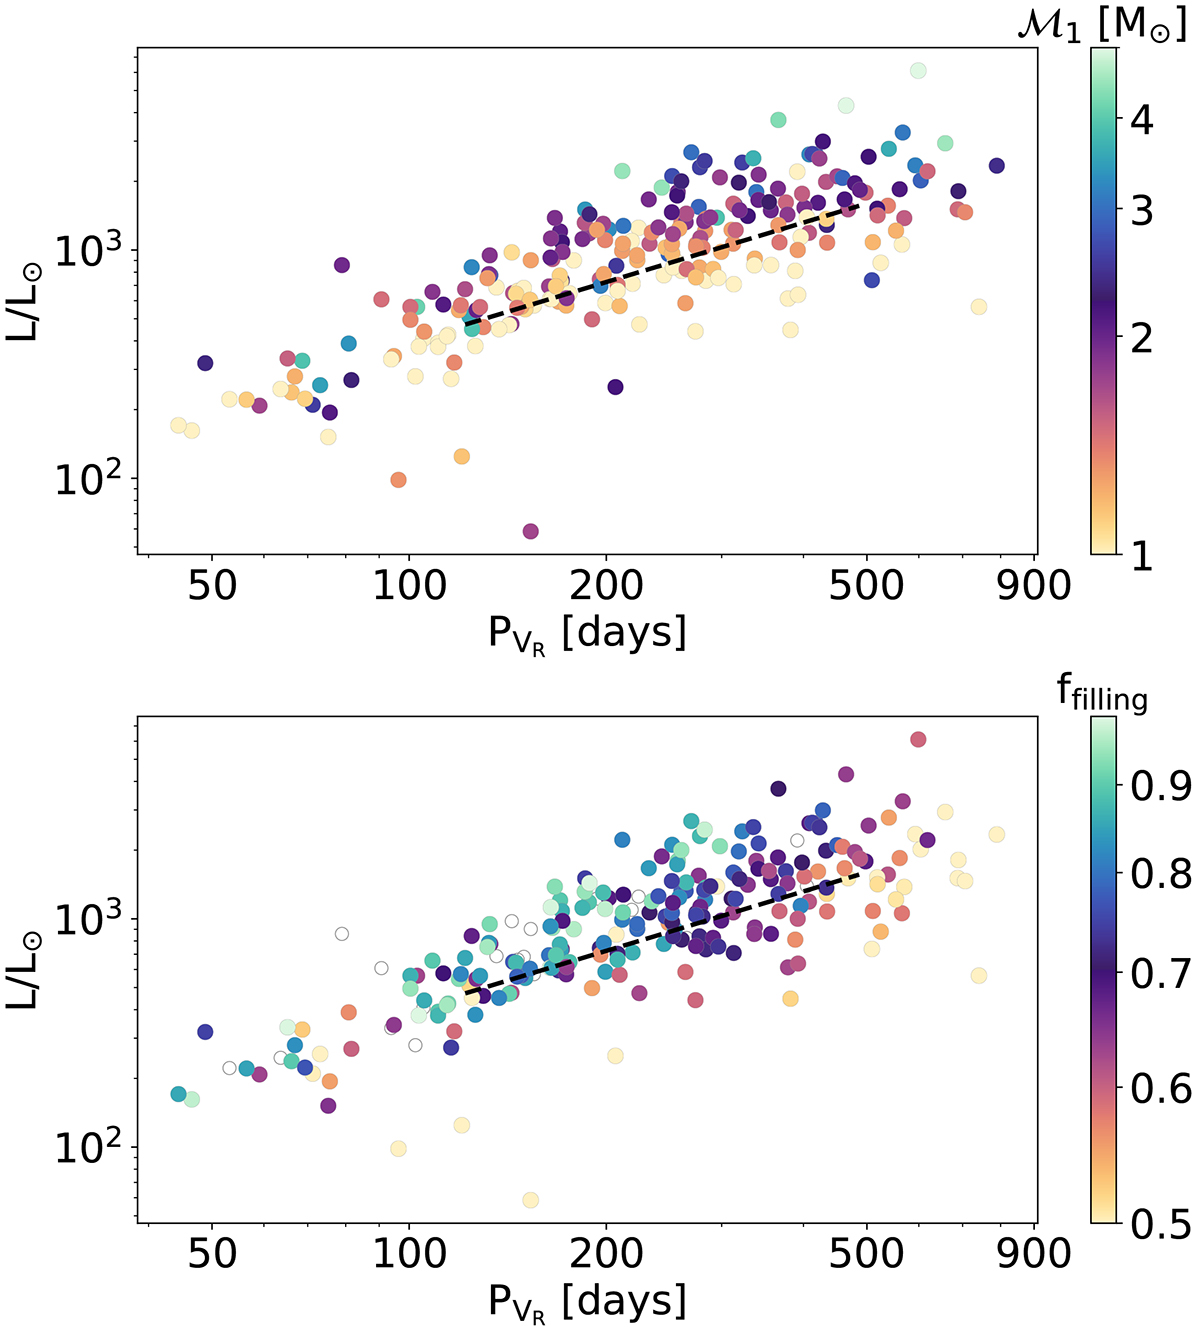
Fig. 19.
Download original image
Period-luminosity diagram for the ellipsoidal candidates. The colors are based on the primary mass (top panel) and filling factor (bottom panel). We note that both color bars are shown in logarithmic scale. Systems having a filling factor larger than one are shown as unfilled circles. In both panels, the black dashed line corresponds to the fit to the sample of low-mass ellipsoidal variables in Nie et al. (2017).
Current usage metrics show cumulative count of Article Views (full-text article views including HTML views, PDF and ePub downloads, according to the available data) and Abstracts Views on Vision4Press platform.
Data correspond to usage on the plateform after 2015. The current usage metrics is available 48-96 hours after online publication and is updated daily on week days.
Initial download of the metrics may take a while.