Fig. 12.
Download original image
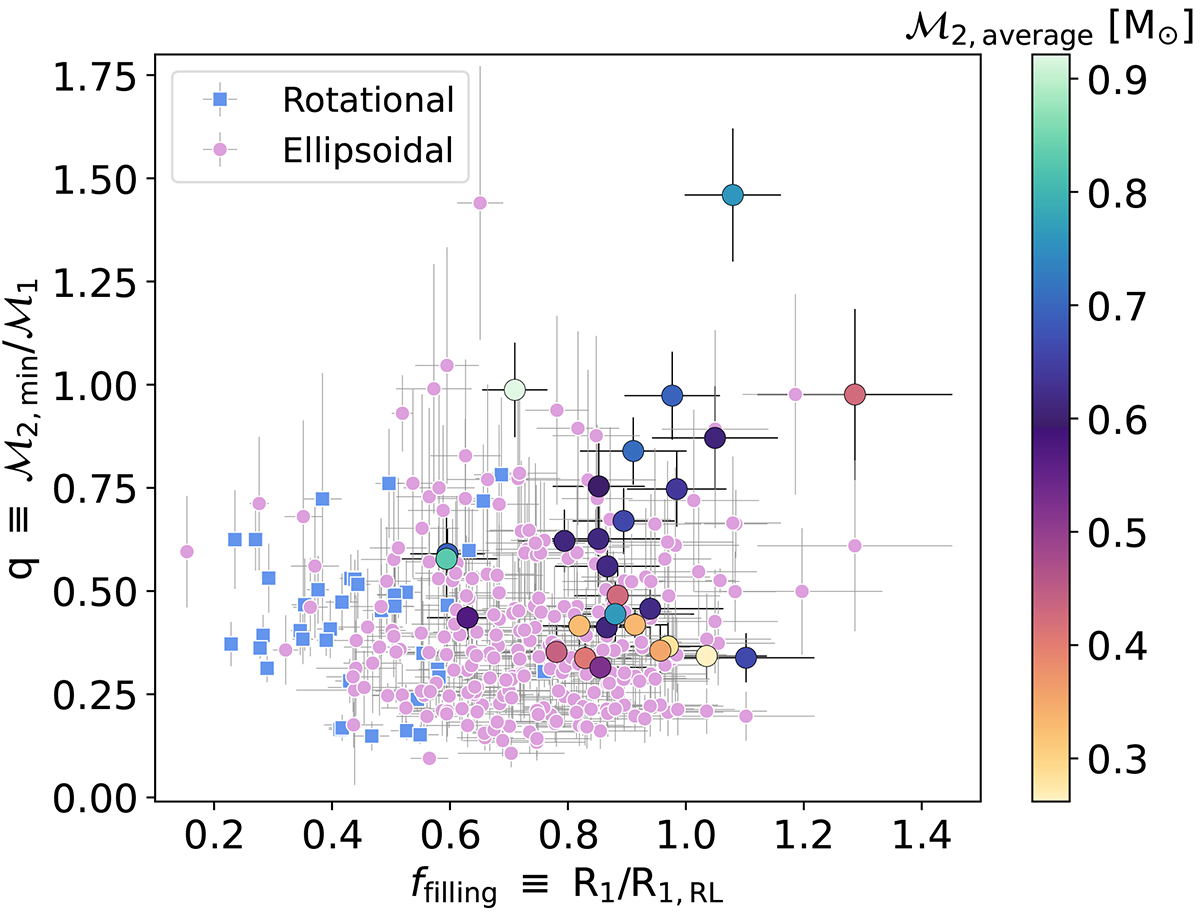
Filling factor versus mass-ratio for rotational candidates (blue squares) and ellipsoidal variable candidates (pale pink circles). For the systems in which the difference between the maximum and minimum mass for the secondary is lower than 1.0 M⊙, the data points are color coded by the average between the maximum and minimum secondary mass, and their mass ratio corresponds to that average mass for the secondary.
Current usage metrics show cumulative count of Article Views (full-text article views including HTML views, PDF and ePub downloads, according to the available data) and Abstracts Views on Vision4Press platform.
Data correspond to usage on the plateform after 2015. The current usage metrics is available 48-96 hours after online publication and is updated daily on week days.
Initial download of the metrics may take a while.