Fig. 8
Download original image
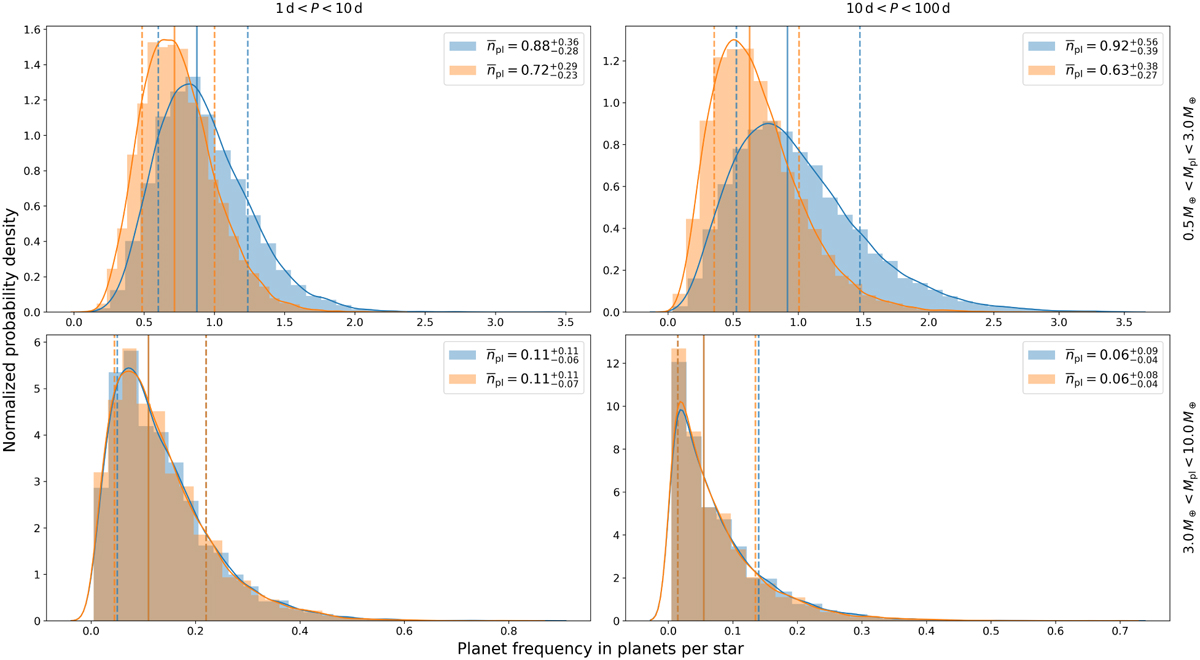
Occurrence rate distributions for different combinations of period and planetary mass ranges. The medians as well as the 16th and 84th percentiles are indicated by vertical solid and dashed lines, respectively. The distributions in blue are based on an underlying power-law distribution for the planet masses, while the orange ones are estimated using a log-uniform distribution.
Current usage metrics show cumulative count of Article Views (full-text article views including HTML views, PDF and ePub downloads, according to the available data) and Abstracts Views on Vision4Press platform.
Data correspond to usage on the plateform after 2015. The current usage metrics is available 48-96 hours after online publication and is updated daily on week days.
Initial download of the metrics may take a while.