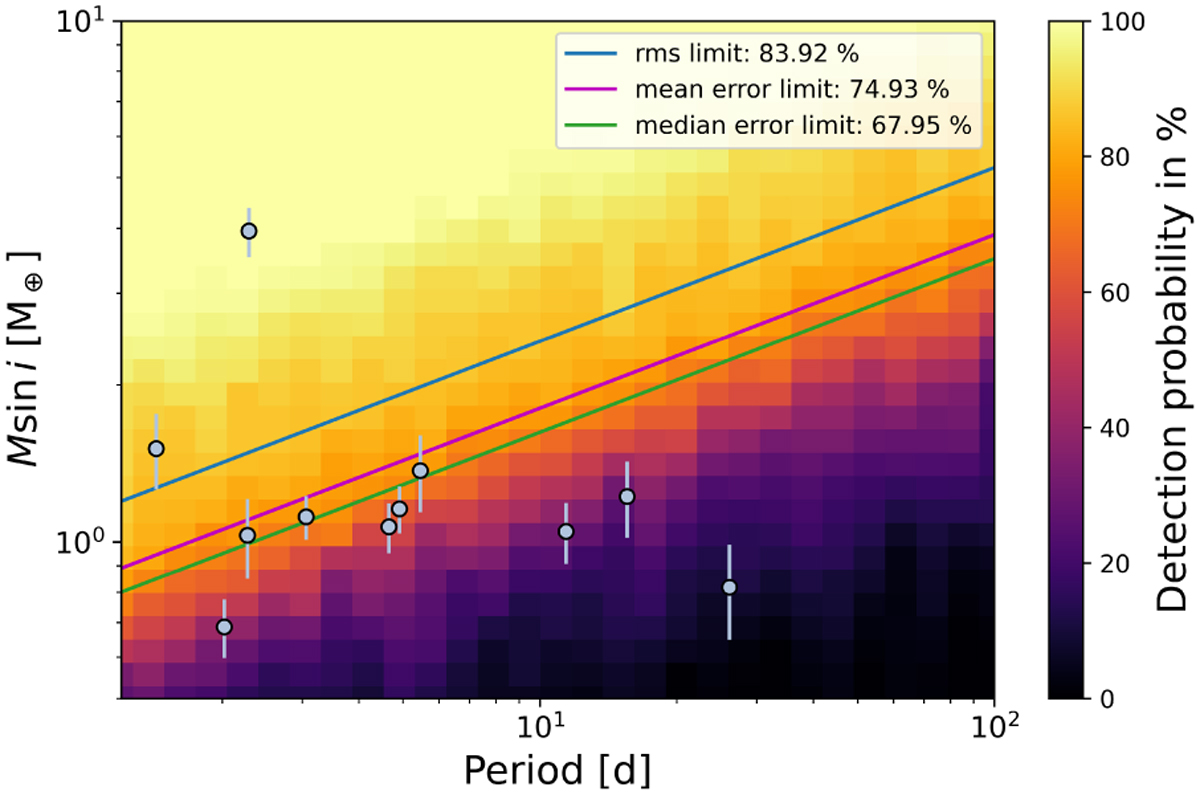
Fig. 7
Download original image
CARMENES detection sensitivity map, averaged over the individual maps of the 15 stellar targets of this study. The light blue markers indicate the 11 planets included for this occurrence rate analysis, and the color map illustrates the detection probabilities of the respective periodmass grid points. The solid lines represent the masses associated to the RV semi-amplitude values equal to the RVs’ root mean square averaged over the time series (blue), the mean RV uncertainties (magenta), and the median of the RV uncertainties.
Current usage metrics show cumulative count of Article Views (full-text article views including HTML views, PDF and ePub downloads, according to the available data) and Abstracts Views on Vision4Press platform.
Data correspond to usage on the plateform after 2015. The current usage metrics is available 48-96 hours after online publication and is updated daily on week days.
Initial download of the metrics may take a while.